Accidents and Pavement Conditions: Linear Referencing
Problem and Objective
Much of geospatial data is tied to x and y locations but their data attributes can be more complex. Thus, presenting linear data in a spatial management system requires a different set of tools. Linear Referencing is the process of storing geographic data to dynamically locate a segment or location across a linear feature. The task of this process is to generate distance measures so that events can be located along a line. This process allows attributes to be displayed, queried, edited and analyzed without effecting the underlying linear feature’s geometry. Thus, the objective of this exercise was to customize Linear Referencing add-ins and locate linear data on a linear feature without using x,y coordinates. For instance, the city of Greenville, NC is interested in the relationship between accidents and pavement conditions in Pitt county. In this exercise, I learned to create a Linear Referencing process to locate accidents along different road ratings of a route ratings.
Analysis Procedure
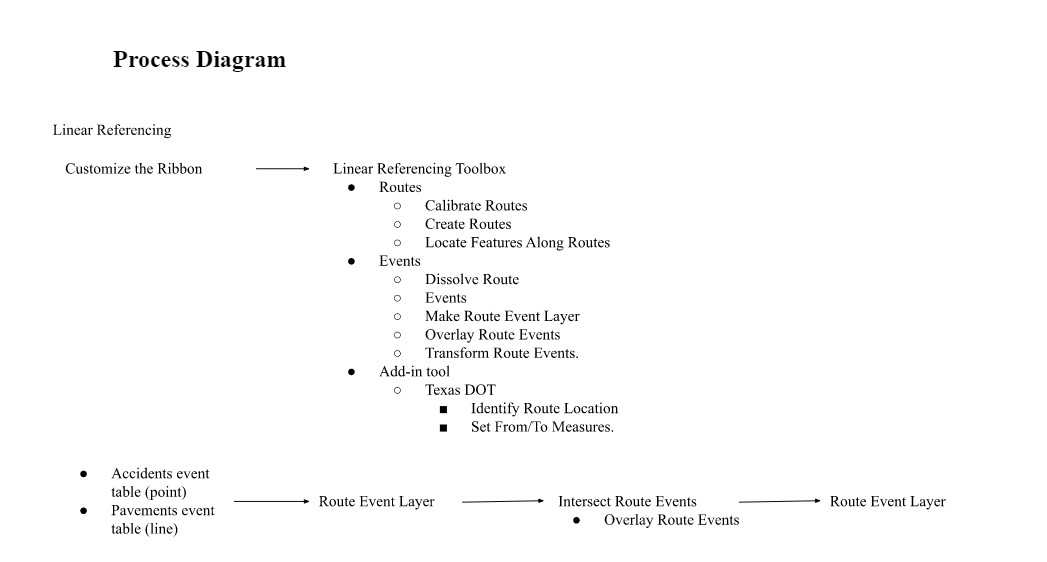
In order to represent linear data, a Linear Referencing system needs to be established that can store related tables and their associations between the tabular information and the spatial data . Thus, this inventory system of spatial features require the customization of the ArcGIS Pro interface ribbon with tabs and groups of third party add-in tools related to Linear Referencing. To complete this exercise, I installed the tools Calibrate Routes, Create Routes, Locate Features Along Routes, Dissolve Route Events, Make Route Event Layer, Overlay Route Events, and Transform Route Events; from the TexasDOT, I had to install the tools Identify Route Locations and Set From/To Measures. Data was provided from a geodatabase containing routes, accidents, pavement , city and county boundary data of Pitt County, NC.
After I created my customized Linear Referencing ribbon, I explored the routes in the data using the Explore function Calibrate Routes, Create Routes and Identify Route Locations tools. After assessing the data, I wanted located the accidents along the different route ratings. I created route event and pavement event layers from the tabular data using the Make Route Event Layer tool. This created event layers/ tables of accidents and road ratings, which could be used to described the conditions and events along the linear features. For example, a route event is a line event that describes a portion of a line and allows multiple attributes to be associated with any portion of the line and has a stored measurement system. The accident event table consisted of point events, which describe discrete locations along a route. The pavement event table consisted of line events, which describe a portion of a route. Lastly, to describe the relationship between accidents (point events) and pavement conditions (line events), I intersected the event layers using the Overlay Route Events and Make Route Event Layer tools. The intersection of route events consists of combining point and segments that occupy common space and creating a new event table with both event tables. In this assignment, pavement event lines and accident event points were intersected. With the combined layer, I was able to use the Select by Attribute tool to search for accidents that occurred on routes with poor pavement ratings.
Results
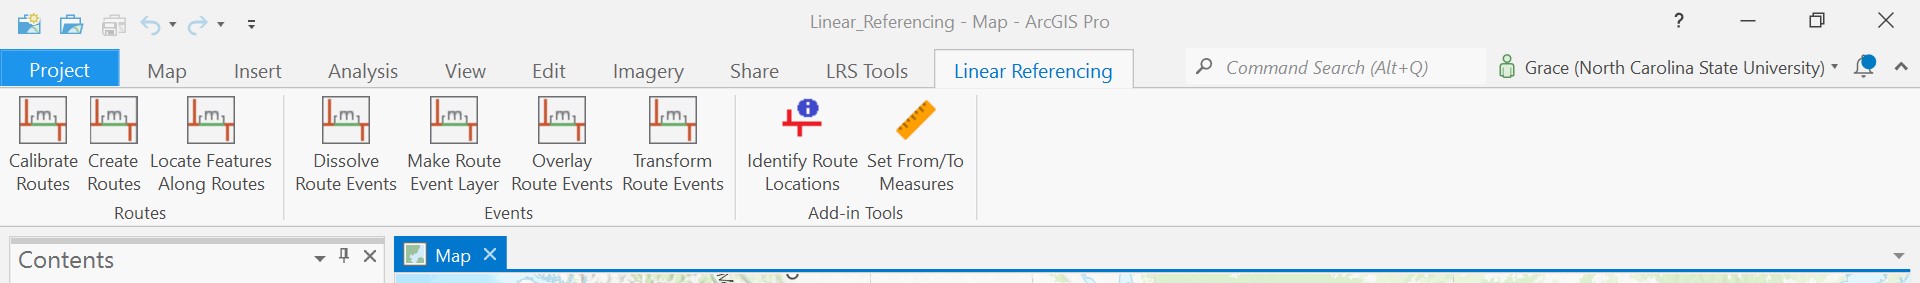
ArcGIS Pro Customized Linear Referencing Ribbon
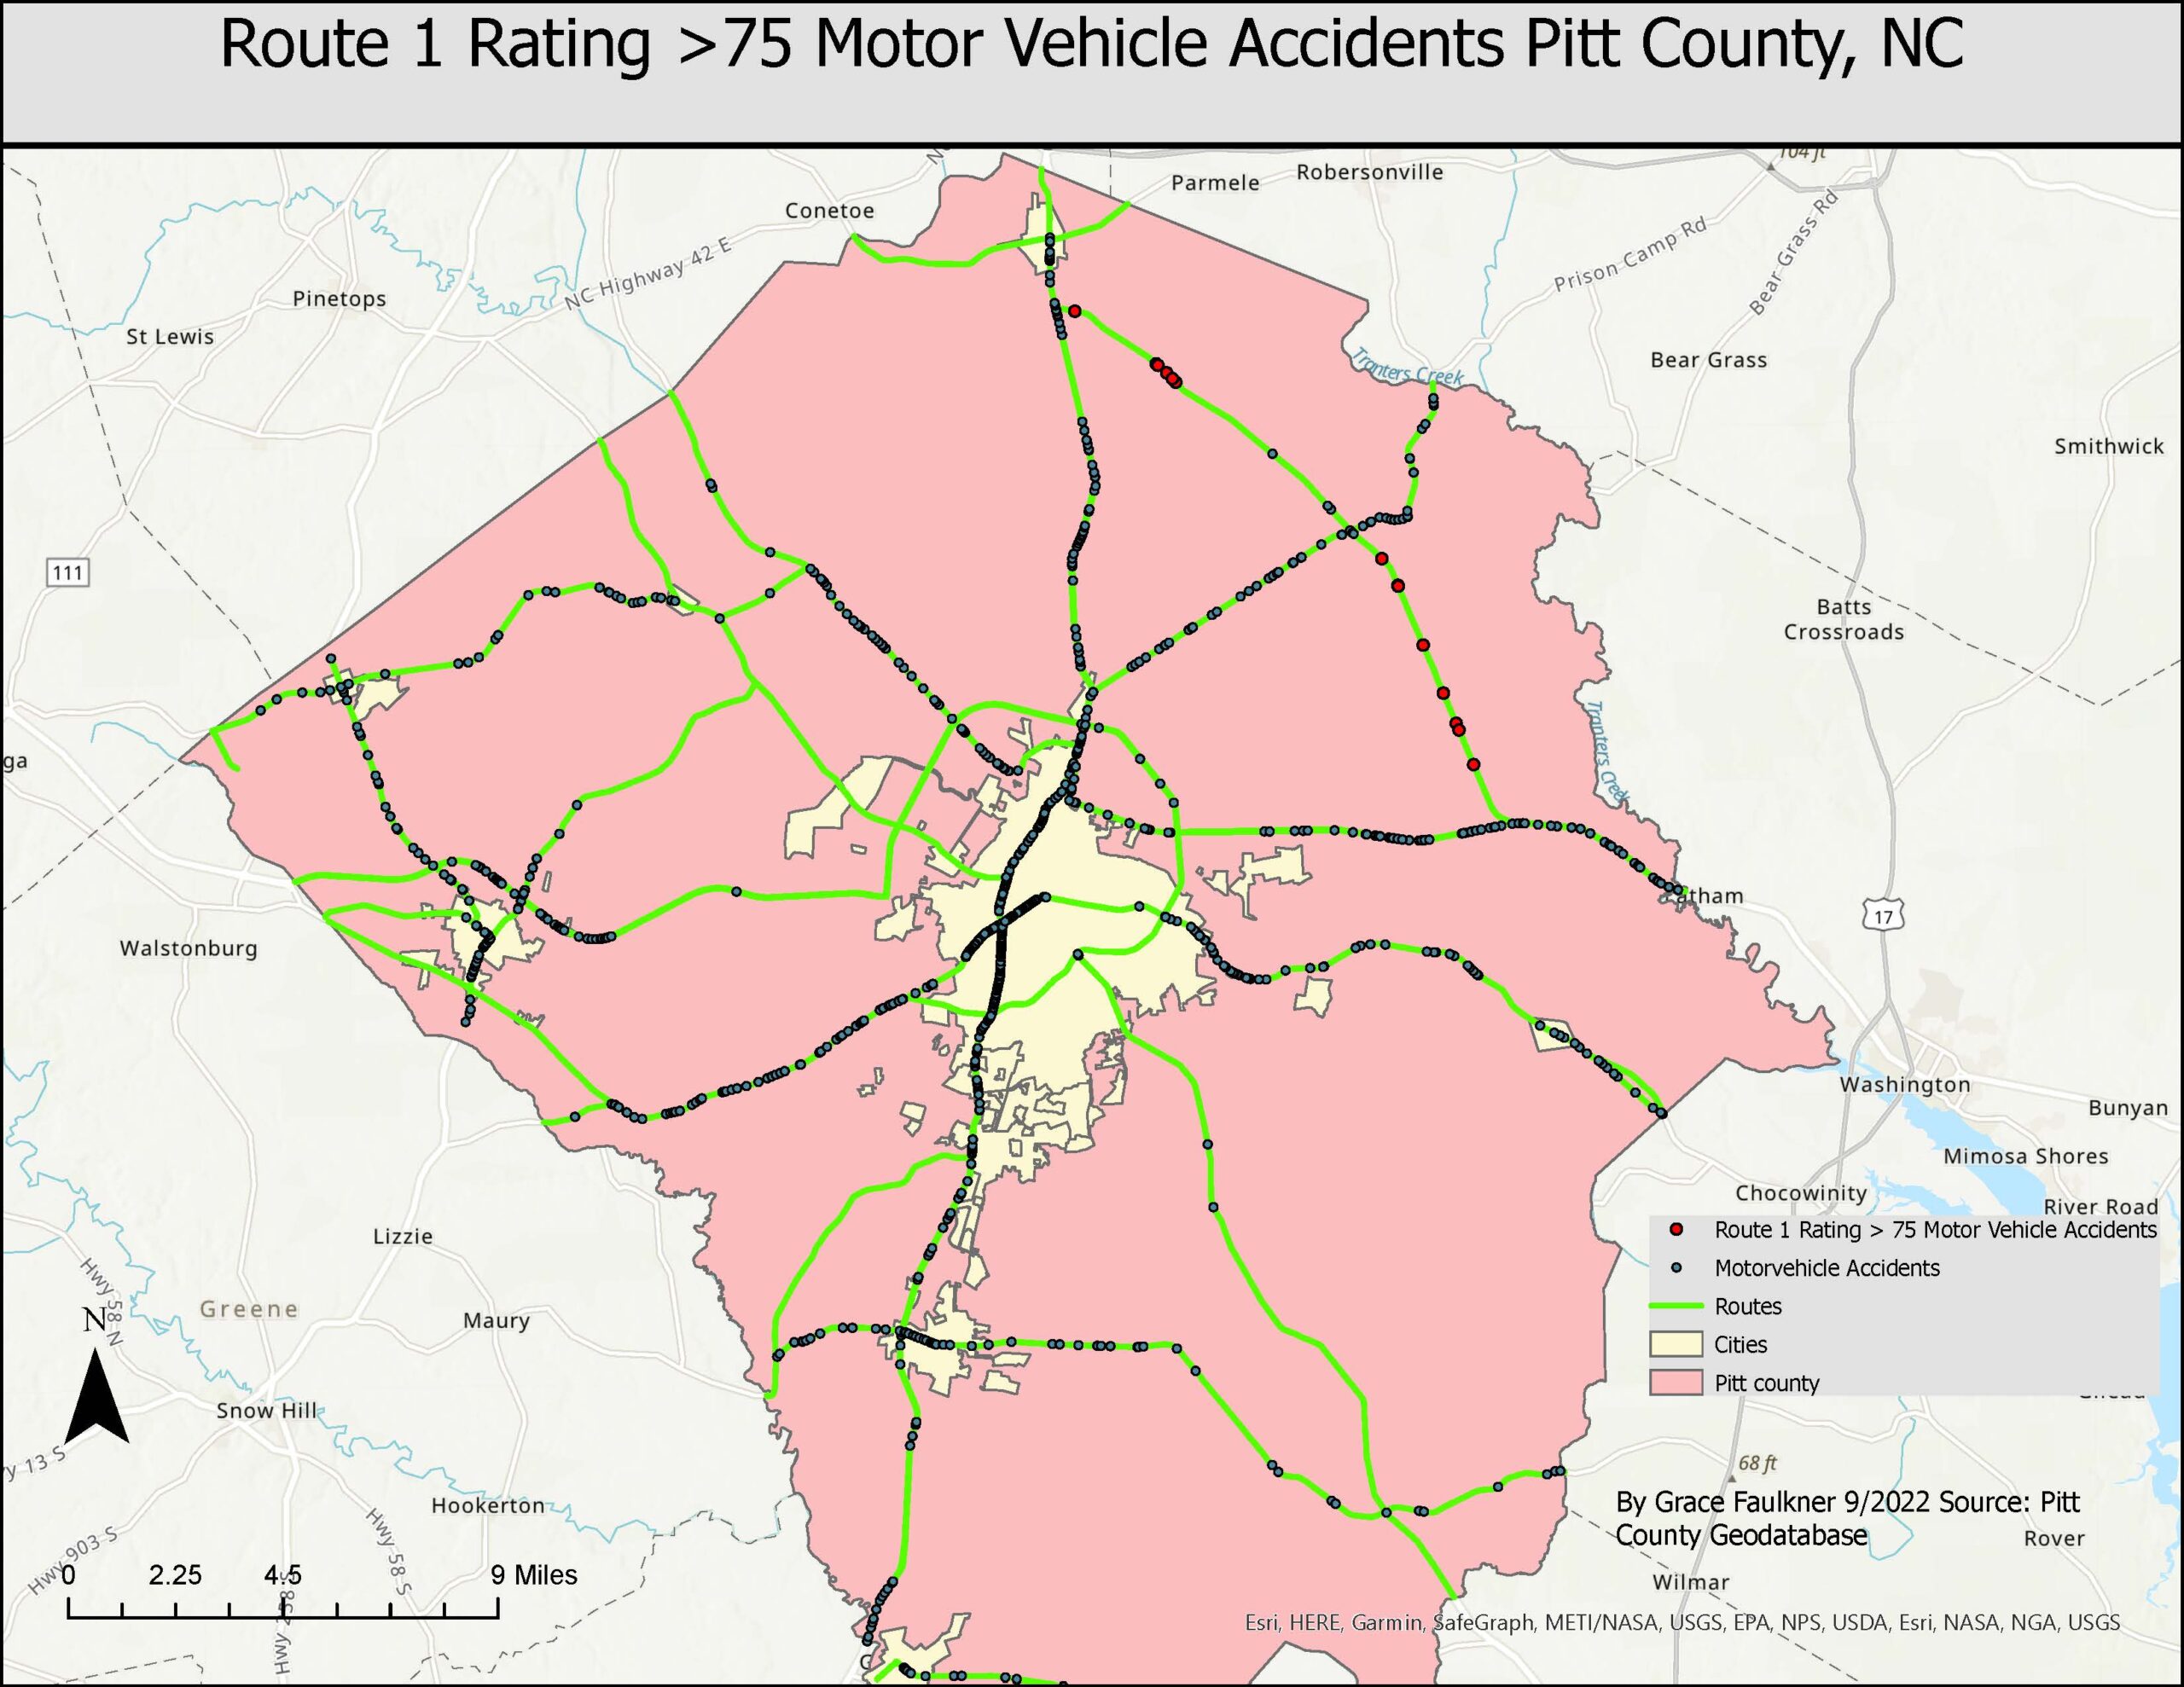
Pitt County, NC Road Conditions and Accidents
Application and Reflection
The Linear referencing toolbox gives GIS users the ability to organize and analyze linear features with dynamic attributes. Linear features such as roads, railroads, trails, and rivers are constantly changing and can be associated with many different attributes. Linear Referencing allows these systems to be linearly modeled without explicit x,y coordinates and still be associated to different attributes along portions of the linear feature. In this assignment, I was able to locate accidents along different road ratings of a route. Through dynamic segmentation, accident events were stored in an event table and then visually displayed on the map with linear referencing. This could be applied to other sectors beyond transportation.
- Problem Description: During intense storm events, many homes and businesses may lose power due to damaged powerlines. Energy sectors may be interested in creating a linear referencing system to identify and analyze power outages along powerline routes. This system could help dispatch repair crews to the portions of the powerline that need restoration and keep homes/business updated.
- Data Needed: In order to create a linear referencing system of energy disruption, utilities would need to have spatial data on where their powerline is located. Utilities would also need to have address location of their customers as it relates to the powerlines. In North Carolina, power outage data is automatically reported from utilities every 30 minutes.
- Analysis Procedures: First the ArcGIS interface would need to be customized for linear referencing with third-party add in tools such as Calibrate Routes, Create Routes, Locate Features Along Routes, Dissolve Route Events, Make Route Event Layer, Overlay Route Events, and Transform Route Events. Then, the routes and event layers could be created. For example, using the Create Routes tool, input line features could be merged to create a single route from existing lines. This could be used to create routes of the powerline line data and associated homes/business they serve. After creating the powerline routes, an event table of the powerline customers and the powerline outages would need to be created using the Make Route Event Layer. In order to determine what customers are impacted during a power outage, the point (power outage event) and line (powerline route event) layers would need to be intersected. With the combined layer, utility companies could locate where the power outages are occurring on what portions of the powerline (route) in order to restore power to associated customers impacted.