Refuge Management using Supervised Image Classification
Problem and Objective
Image classification is a technique that selects sample pixels that are representative of specific classes in an image. This technique allows for the classification of all other pixels in an image. Supervised image classification is the ability to classify imagery based on user-identified classes within a raster dataset. This technique typically utilizes remote sensing images based on the electromagnetic spectrum (specifically red, blues and greens). The objective of this exercise was to develop a methodology of supervised image classification to identify land cover classes using aerial photography. For example, managers at the Black Water National Wildlife Refuge are interested in land cover data of the refuge in order to develop a management plan. The objective of this assignment was to develop a methodology of supervised image classification to identify land cover classes throughout the refuge. In this exercise, I gained an understanding of supervised image classification and land cover class designations from the Multi-Resolution Land Characteristics Consortium.
Analysis Procedure
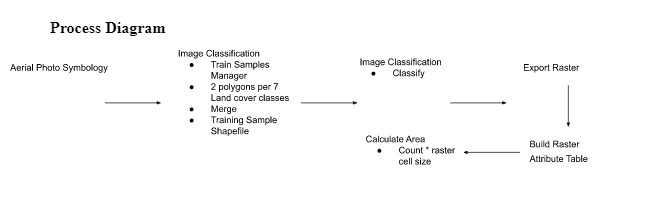
The objective of this assignment was to create and perform a supervised image classification methodology. The Classification Wizard can help guide this process on a remote sensing image in ArcPro . In order to develop a supervised image classification of the land cover classes in the refuge, I used ArcGIS Pro 2.9 and the Classification toolbox on an aerial photo of the refuge. The aerial photo and land cover class designations of the refugee were provided by the instructor. I used the Training Samples Manager and Classify tools to generate training polygons of sample land cover classes. I also created a raster file of the classified layer and built an attribute table to compare the areas of classification after two rounds of classification.
After I added the aerial photo to the map, I created training sample polygons for the classification. Using the Training Samples Manager, I identified two polygons for each land cover classification throughout the different areas of the refuge. I then merged the polygons and saved the results as a shapefile. Next, I used the shapefile and the Classify tool to identify the land cover present in the aerial photo. Then, I exported the classification as a raster file and generated a raster attribute table. This table was used to calculate the area of pixels for each land cover class. I then repeated this process in a second round of classification with additional polygons in order to compare my classification methodology.
Results
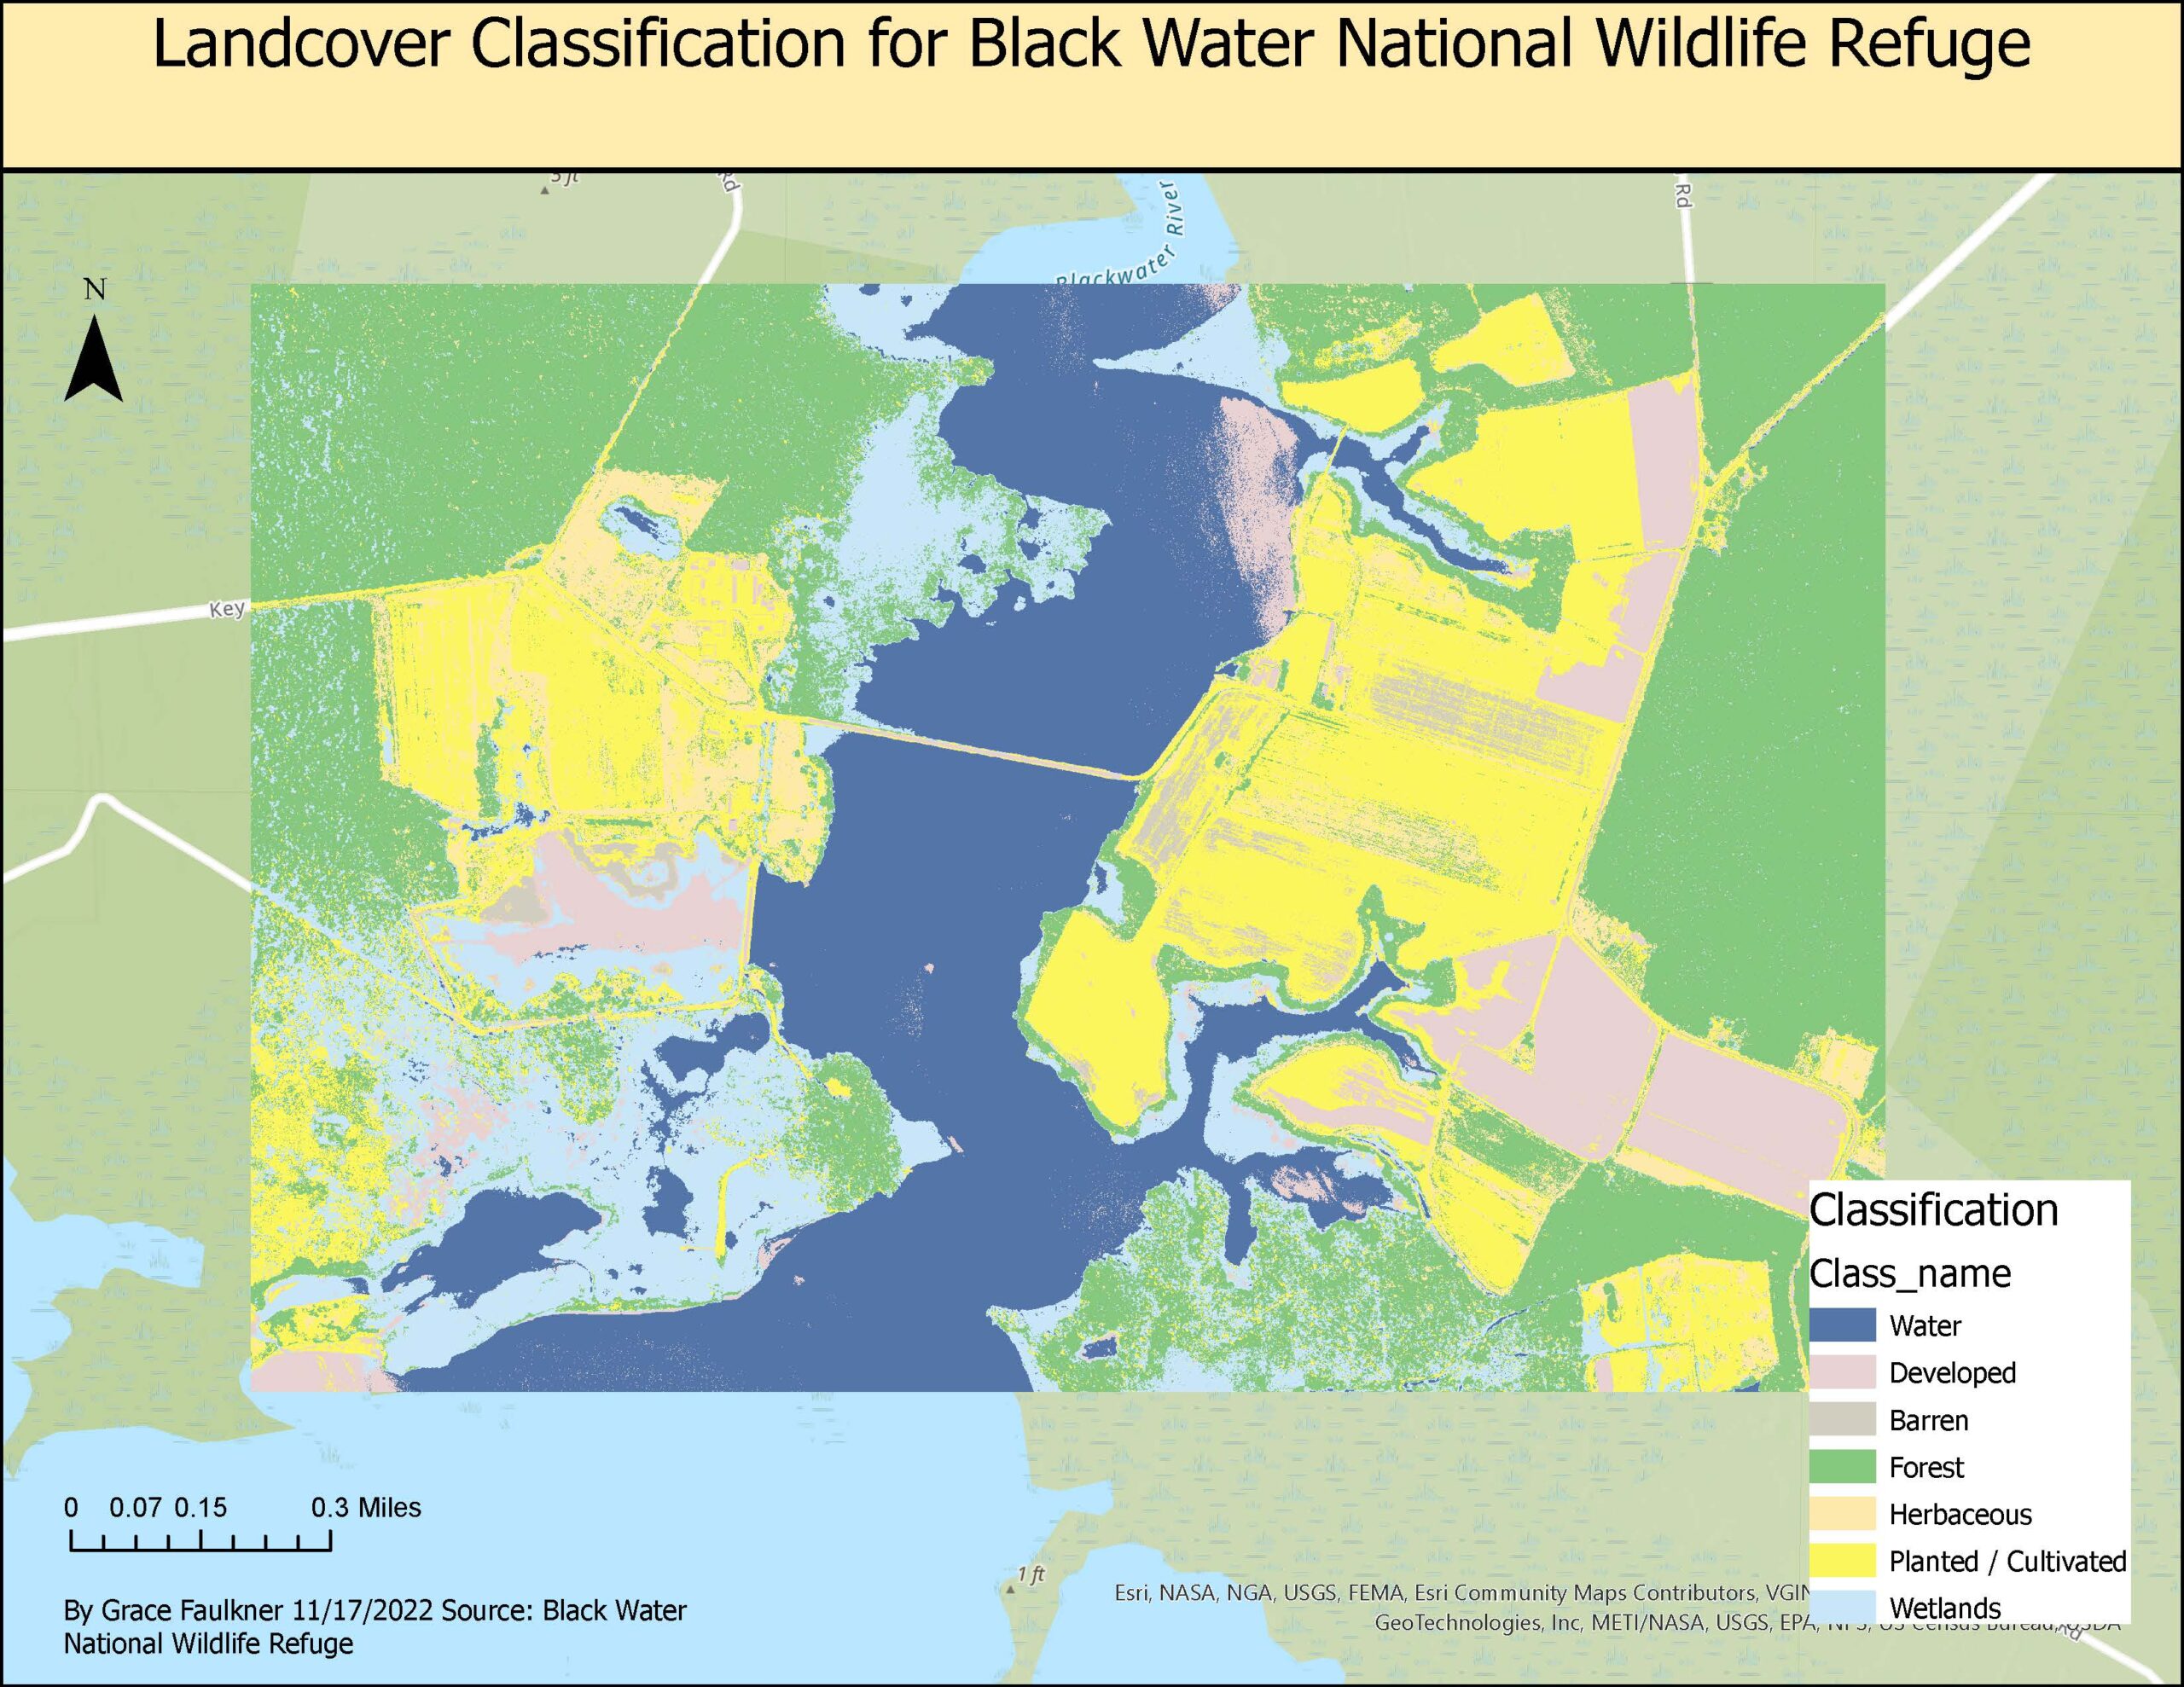
Black Water National Refuge Landcover Classification for Management
Application and Reflection
Image classification allows GIS analysts the ability to accurately and quickly classify large areas using satellite imagery or other remote sensing products. Using a true color composite image, I was able to select sample pixels that were representative of specific land classes in the provided image. These samples were then applied to the whole of the image to distinguish the land cover classes throughout the refuge. This technique can be used beyond park management and the seven land classes in the assignment. For example, the Multi-Resolution Land Characteristics Consortium has 20 different land classes. There are further designations for cultivated land such as hay pasture or degrees of development (low, medium, and high intensity).
- Problem Description: With an interest in land use changes and consumption, areas that were once forested but are now being used for agriculture could be analyzed over time to see how much forested land cover has been lost. Deforestation has been a major problem in Brazil and many forested areas have been converted into farming areas. For example, NASA has been documenting deforestation in the Amazon rainforest using satellite imagery of the Amazon rainforest.
- Data Needed: Using remote sensing images and Land Cover Class designations from Multi-Resolution Land Characteristics Consortium, changes in land cover could analyzed. Satellite imagery of the earth is available for download from the U.S. Geological Survey and could be coupled with the National Land Cover Database (NLCD), which provides data on land cover and classes.
- Analysis Procedures: After obtaining an aerial photo of the land of interest, I would change the symbology of the image to reflect the red, blue, and green bands of the image. Next, using the Classification toolbox on the image, I would create training polygons that represent the land cover classes observed, such as the difference by forested land and cultivated land. I would select at least two polygons per land cover class in order to help ‘train’ the tool for classification of the rest of the image. After merging the polygons and saving the training samples to a shapefile, I would use the Classify and Export Raster tool in order to identify the rest of the land cover designations in the image and create a raster output and data table. The output table would be used to calculate the area of pixels for each land cover class by multiplying the count filed by the raster cell size measurements. With the visual and the calculated values, I would be able to see where any land cover change is occurring and quantify how much change is occurring.