Identifying Customer Location for Market Penetration
Problem and Objective
Often times, one of the first things that comes to mind when thinking about maps are addresses or coordinates. Even though an address or a set of coordinates represents a spatial location, this data often found in a tabular form and at a variety of different geographic scales (street address, ZIP code, county, place name, etc). Thus, this data must be geocoded in order to answer any kind of spatial question. The objective of this geocoding exercise was to create spatial locations from address descriptions using a Geolocator. For example, a local business in Raleigh, NC is planning to expand their customer reach and is interested in developing a marketing campaign for new potential customers. For successful market penetration, the business needs to spatially analyze the locations of their current customers, which will help to identify areas of under-representation throughout Wake County. Using customer address information obtained from the local business, I identified and visually displayed the location of the current customer base. At the end of this exercise, I I learned to identify methods in ArcGIS Pro to geocode tabular data and performed a batch geocoding procedure. I also had a better understood the limitations of tabular ‘address’ data.
Analysis Procedure
The process of geocoding involves transforming a description of location (coordinates, address, name of place) to a location on earth’s surface (such as a point feature). This process requires input data such as an address or place name, a locator to link the data to geographic coordinates, and reference data like ZIP codes or streets that compares the input data.
In this exercise, I used ESRIs ArcGIS Pro 2.8 and the tools Create Address Locator and Geocode Addresses in the Geocode Toolbox. From the instructor, I was provided with tabular data of customer addresses in a Microsoft Excel spreadsheet and vector shapefiles of Wake County Zip Code polygons, Wake County Streets, and the Wake County Boundary line. The shapefiles were obtained from the Wake County Government GIS Map Services Website.
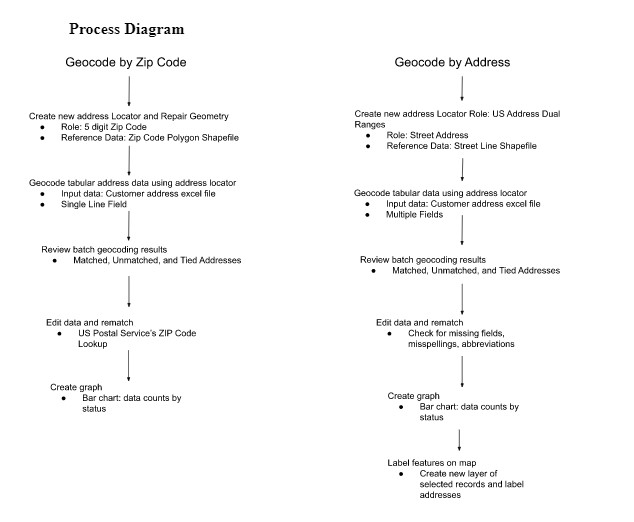
First, I created two Geolocators in order to visualize the tabular data of the current customer base. The customers were geocoded according to their 5-digit Zip code. Using the single line field and reference Zip code polygon shape file, the customer addresses were assigned to the centroid of each Zip code polygon. After batch geocoding, the addresses were reviewed for Matched, Unmatched, and Tied status. Tied addresses were rematched according to the US Postal Service Zip Code Lookup and match score. When creating the Locator by address, the whole customer address (multiple fields) and Street line shapefile were used. Similarly, after batch geocoding, addresses were reviewed for Matched, Unmatched, and Tied status and spelling errors were corrected. Three addresses were selected to be located and labeled on the map. After both Geolocators were created, a bar chart was created to also review the Matched, Unmatched, and Tied status before and after rematching. Finally, two maps were created and exported to show the layout of customers across the county representing the geocoding to Zip code and the other to address.
Results
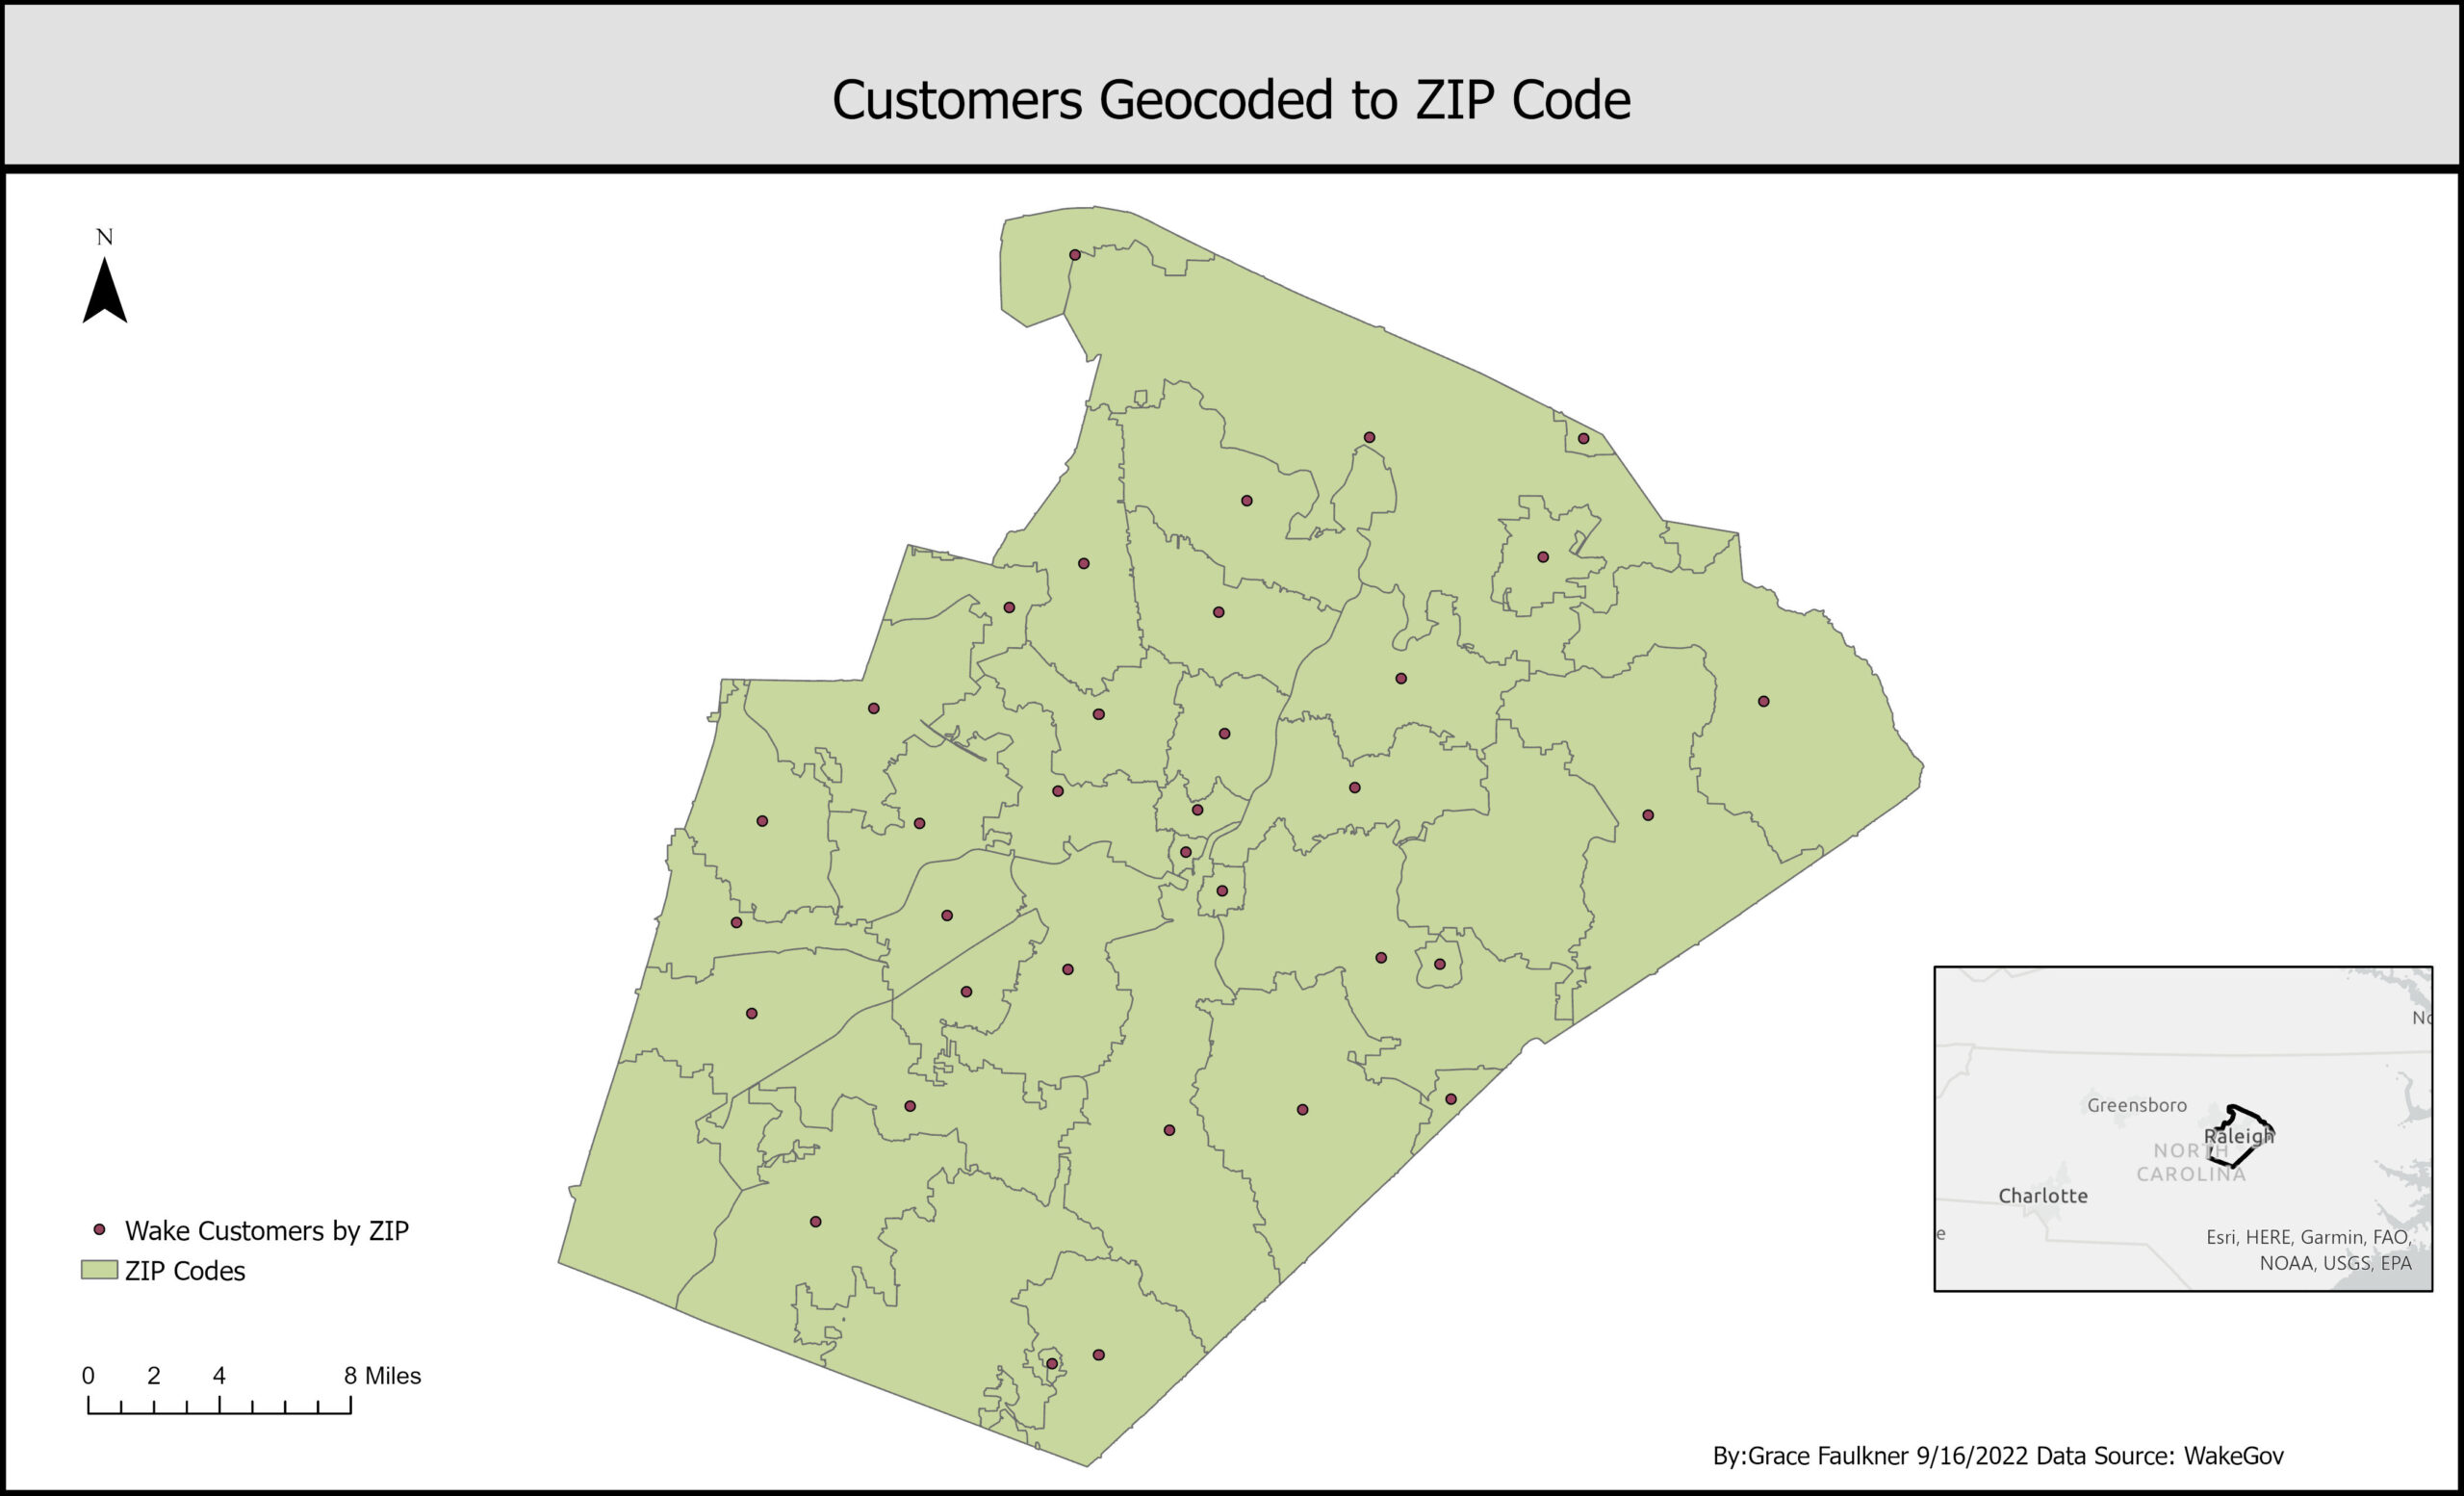
Wake County Customers geocoded to ZIP code using Address Locator
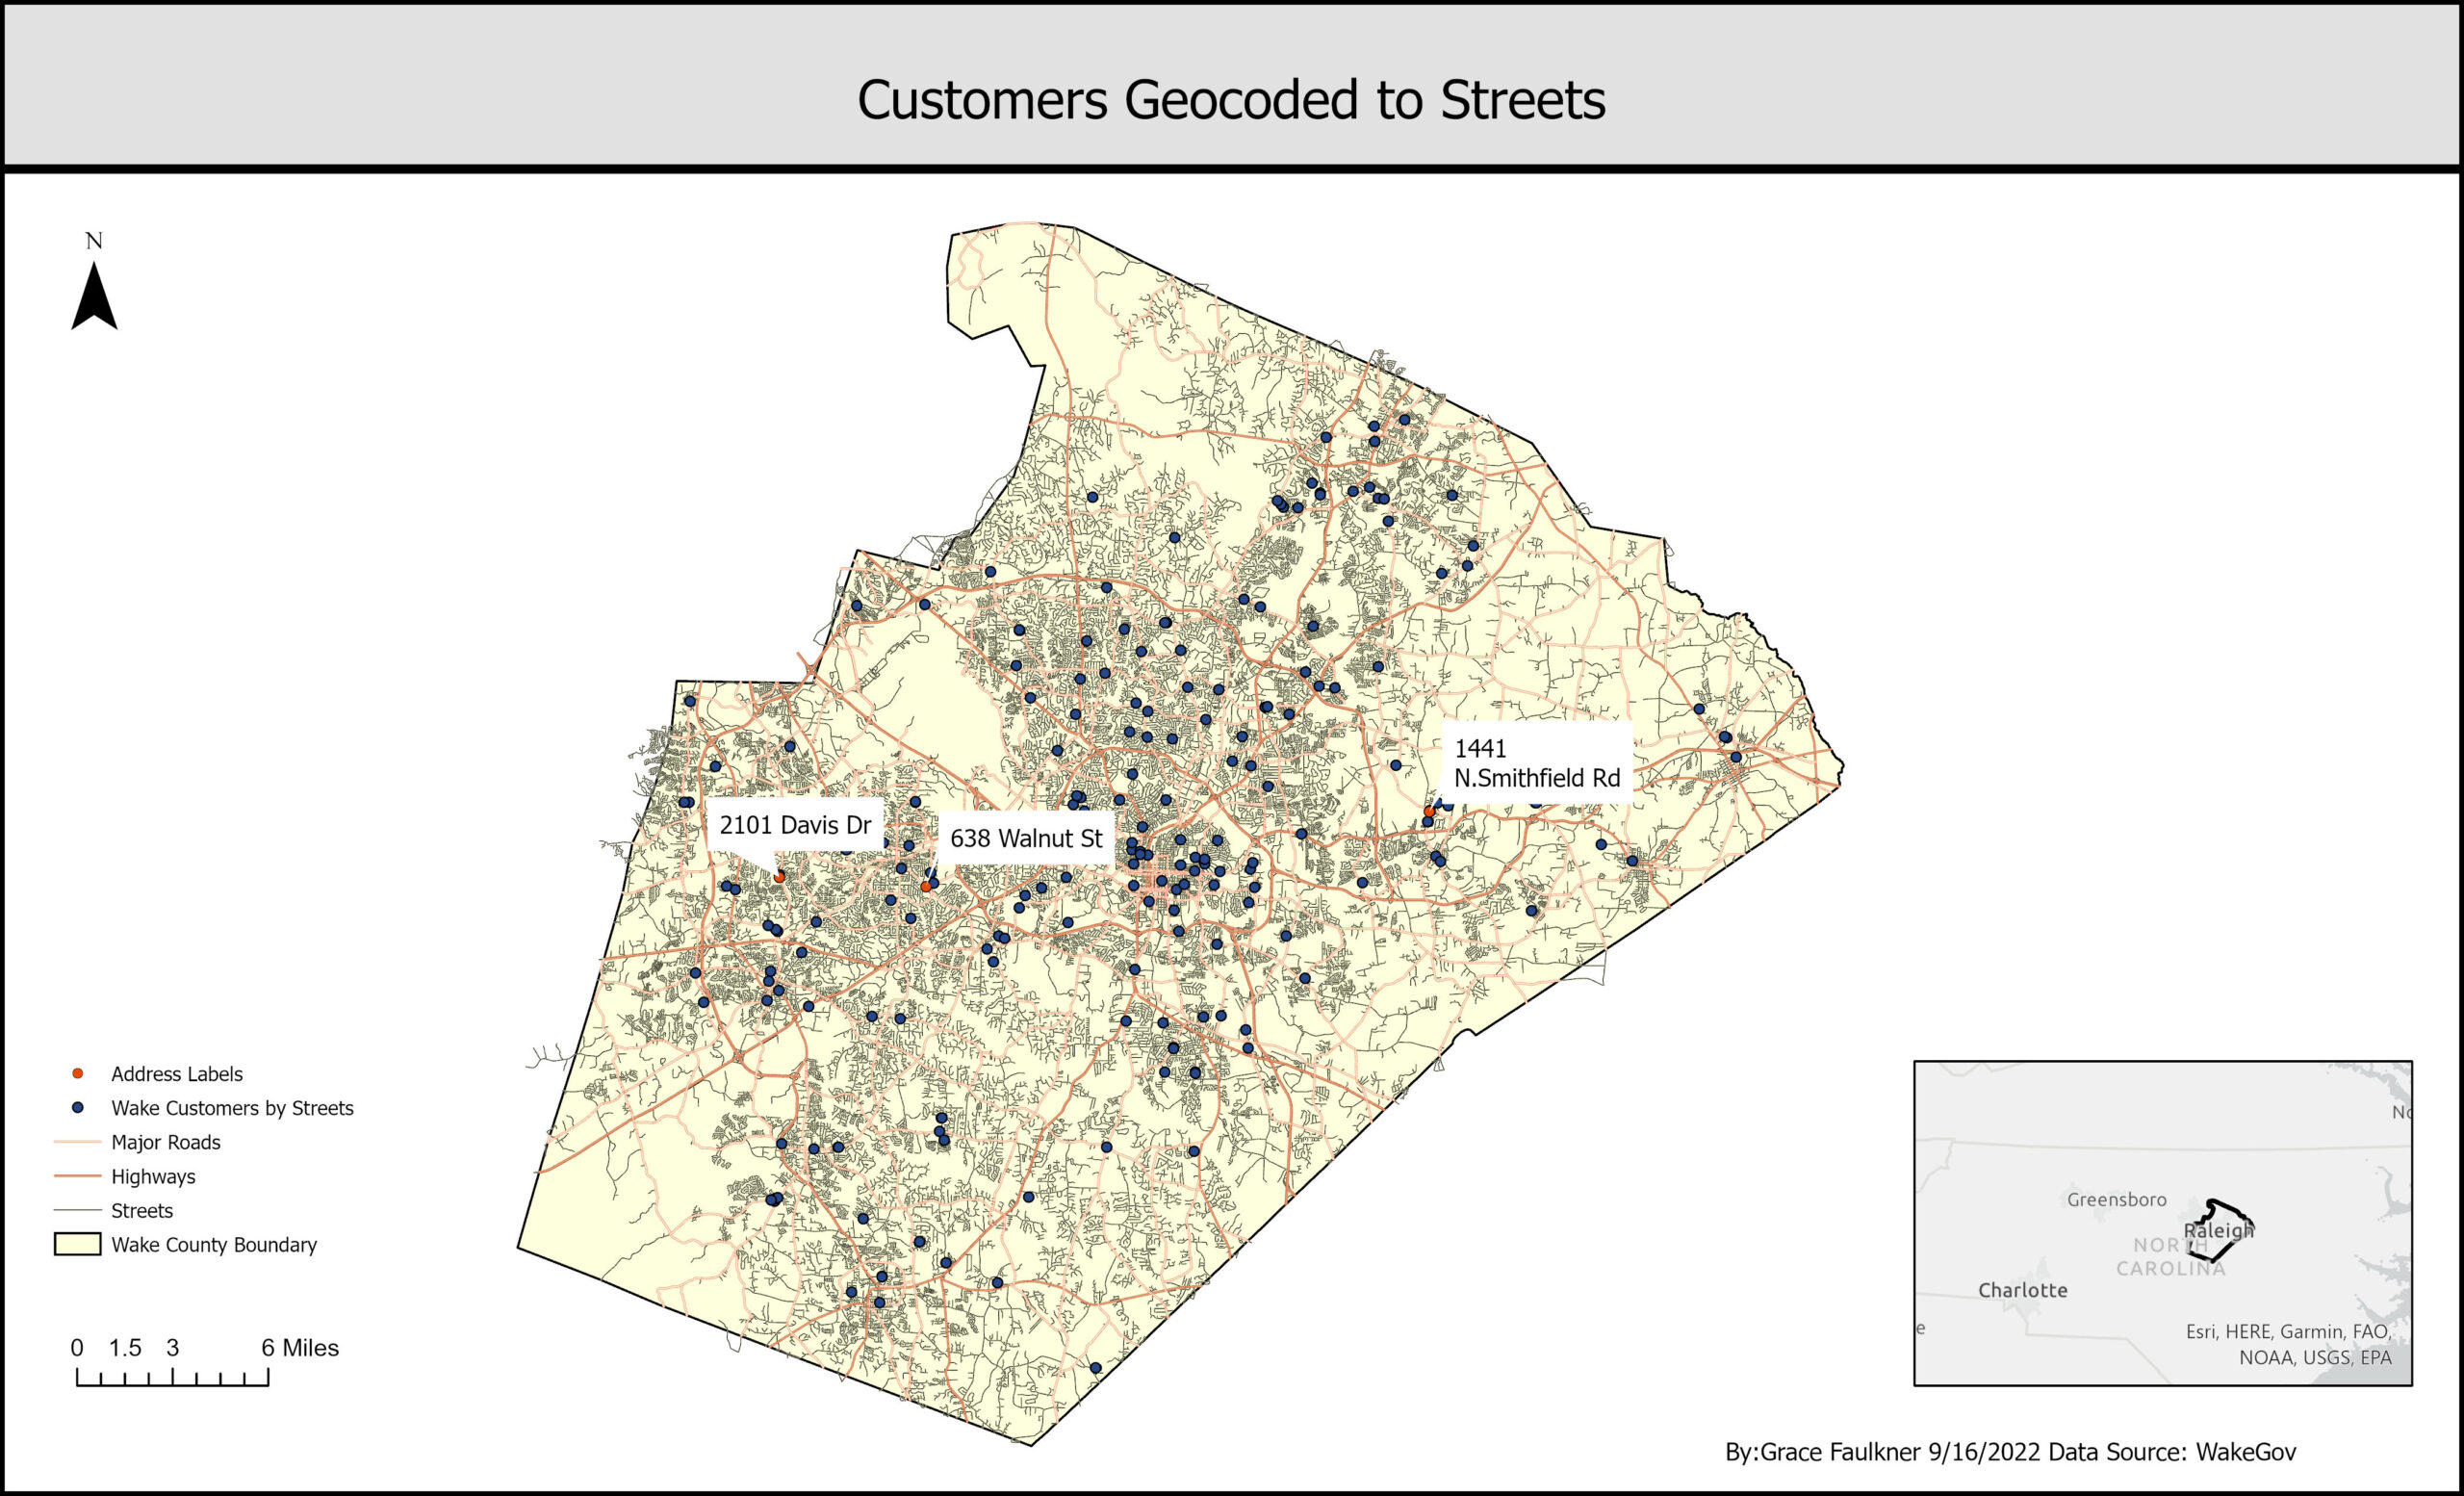
Wake County Customers geocoded to Streets using Address Locator
Application and Reflection
Using the Geocoding process is a useful, informative tool. It creates a direct connection between tabular data and spatial analysis and mapping. Tabular data can exist in a variety of forms such as coordinates, addresses, and location names. By visually placing locations on a map, users can make informed decisions when answering questions. This is applicable to business decisions, as seen in the project with marketing and planning, or other fields like public health.
For example, public health departments could use the addresses of reportable disease cases and geocode them throughout the state in order to compare cases to health services/ clinics, resources or exposures nearby. During flu season, this could help determine where mobile health centers are needed.
- Problem description: Public health departments are interested to know the distribution of reportable disease cases throughout the state in order to compare the cases to nearby health services, clinics or exposures. They would like to create a customized map that shows spatial distribution in order to assess needs for resources and/or exposure. They could utilize tabular address data of cases with reportable diseases. For example, the Centers for Disease Control (CDC) collects influenza activity year-round from state, local, and territorial health departments, public health and clinical laboratories, and health care provides and facilities in order to find out when and where influenza activity is occurring and circulating, detect changes in influenza viruses and measure disease burden.
- Data needed: In the U.S., some diseases are required to be reported by physicians to the state and/or the CDC for case surveillance. Using tabular data of reportable disease cases by address, public health professionals and departments could geocode the cases to streets, ZIP codes, county, or state based on case reporting information.
- Analysis procedures: Using a Geolocator, case addresses could be geocoded at the street or other geographic level. At the street level, the Geolocator would have US Address Dual Ranges role with multiple fields of input data. such as street number, street, city, state and zip code. After batch geocoding, the cases would be reviewed for Matched, Unmatched and Tied status and any cases could be re-matched accordingly. After the cases are geocoded and identified, a map could be created to assess where the cases are occurring. This could be used by public health officials to assess flu activity and address any needs for resources or public health services.