Identifying Clustering Patterns over Census Data- Spatial Pattern Analysis
Problem and Objective
Spatial pattern analysis and statistics describes and models the spatial distribution, patterns, processes and spatial relationships between features. After discovering if clustering of features is not occurring due to random chance and significantly clustered, pattern analysis tools can be used locate the clustering and to produce a visual output. Local measures are used to determine how much each feature is similar or dissimilar to its neighbor. The objective of this exercise was to identify cluster patterns of ranked features using cluster and hot spot analyses. For example, after discovering significant clustering of high priority false alarm calls, the Dallas County Fire Department is interested in identifying the clustering patterns. He wants to find hot and cold spots and determine if there is a relationship between call cluster location and median household income. Similarly, the Dallas County Economic Development office is interested in identifying median household income clusters in order to direct charity collection and job creation efforts. In this exercise, I learned to utilize local pattern analysis methods.
Analysis Procedure
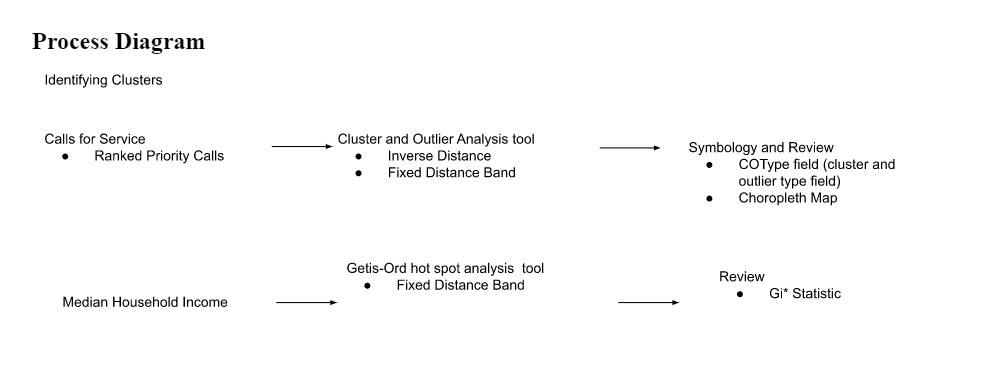
In addition to determining the probability that spatial clustering is not due to random chance, the Spatial Statistics toolbox can also be used identify the locations of clusters. In order to identify the spatial patterns and clustering, I used ArcGIS Pro 2.8, the Mapping Clusters toolset in the Spatial Statistics toolbox and data provided from “GIS Tutorial 2: Spatial Analysis Workbook”. To highlight cluster areas of weighted attribute features, I used the Cluster and Outlier Analysis tool. To identify hot and cold spots, I used the Getis-Ord hot spot analysis tool.
After discovering significant clustering of high priority false alarm calls, I used the Cluster and Outlier Analysis tool to perform pattern analysis of the ranked priority calls. This tool displayed the clustering creating hot spots and cold spots using the COType field, which distinguished statistically significant clusters of high values (HH), low values (LL), and outliers. I used this tool with an inverse distance band conceptualization and fixed distance band conceptualization. I then created a choropleth map of the census data median household income to determine where the clusters were located. In order to identify the median household income locations for the Dallas County Economic Development office, I used the Getis-Ord hot spot analysis tool to display areas where high and low income households are clustered with a fixed distance band. This tool produces the Gi* statistic, which uses both the location and the value in the pattern calculations, to determine how one feature compares to neighbors
Results
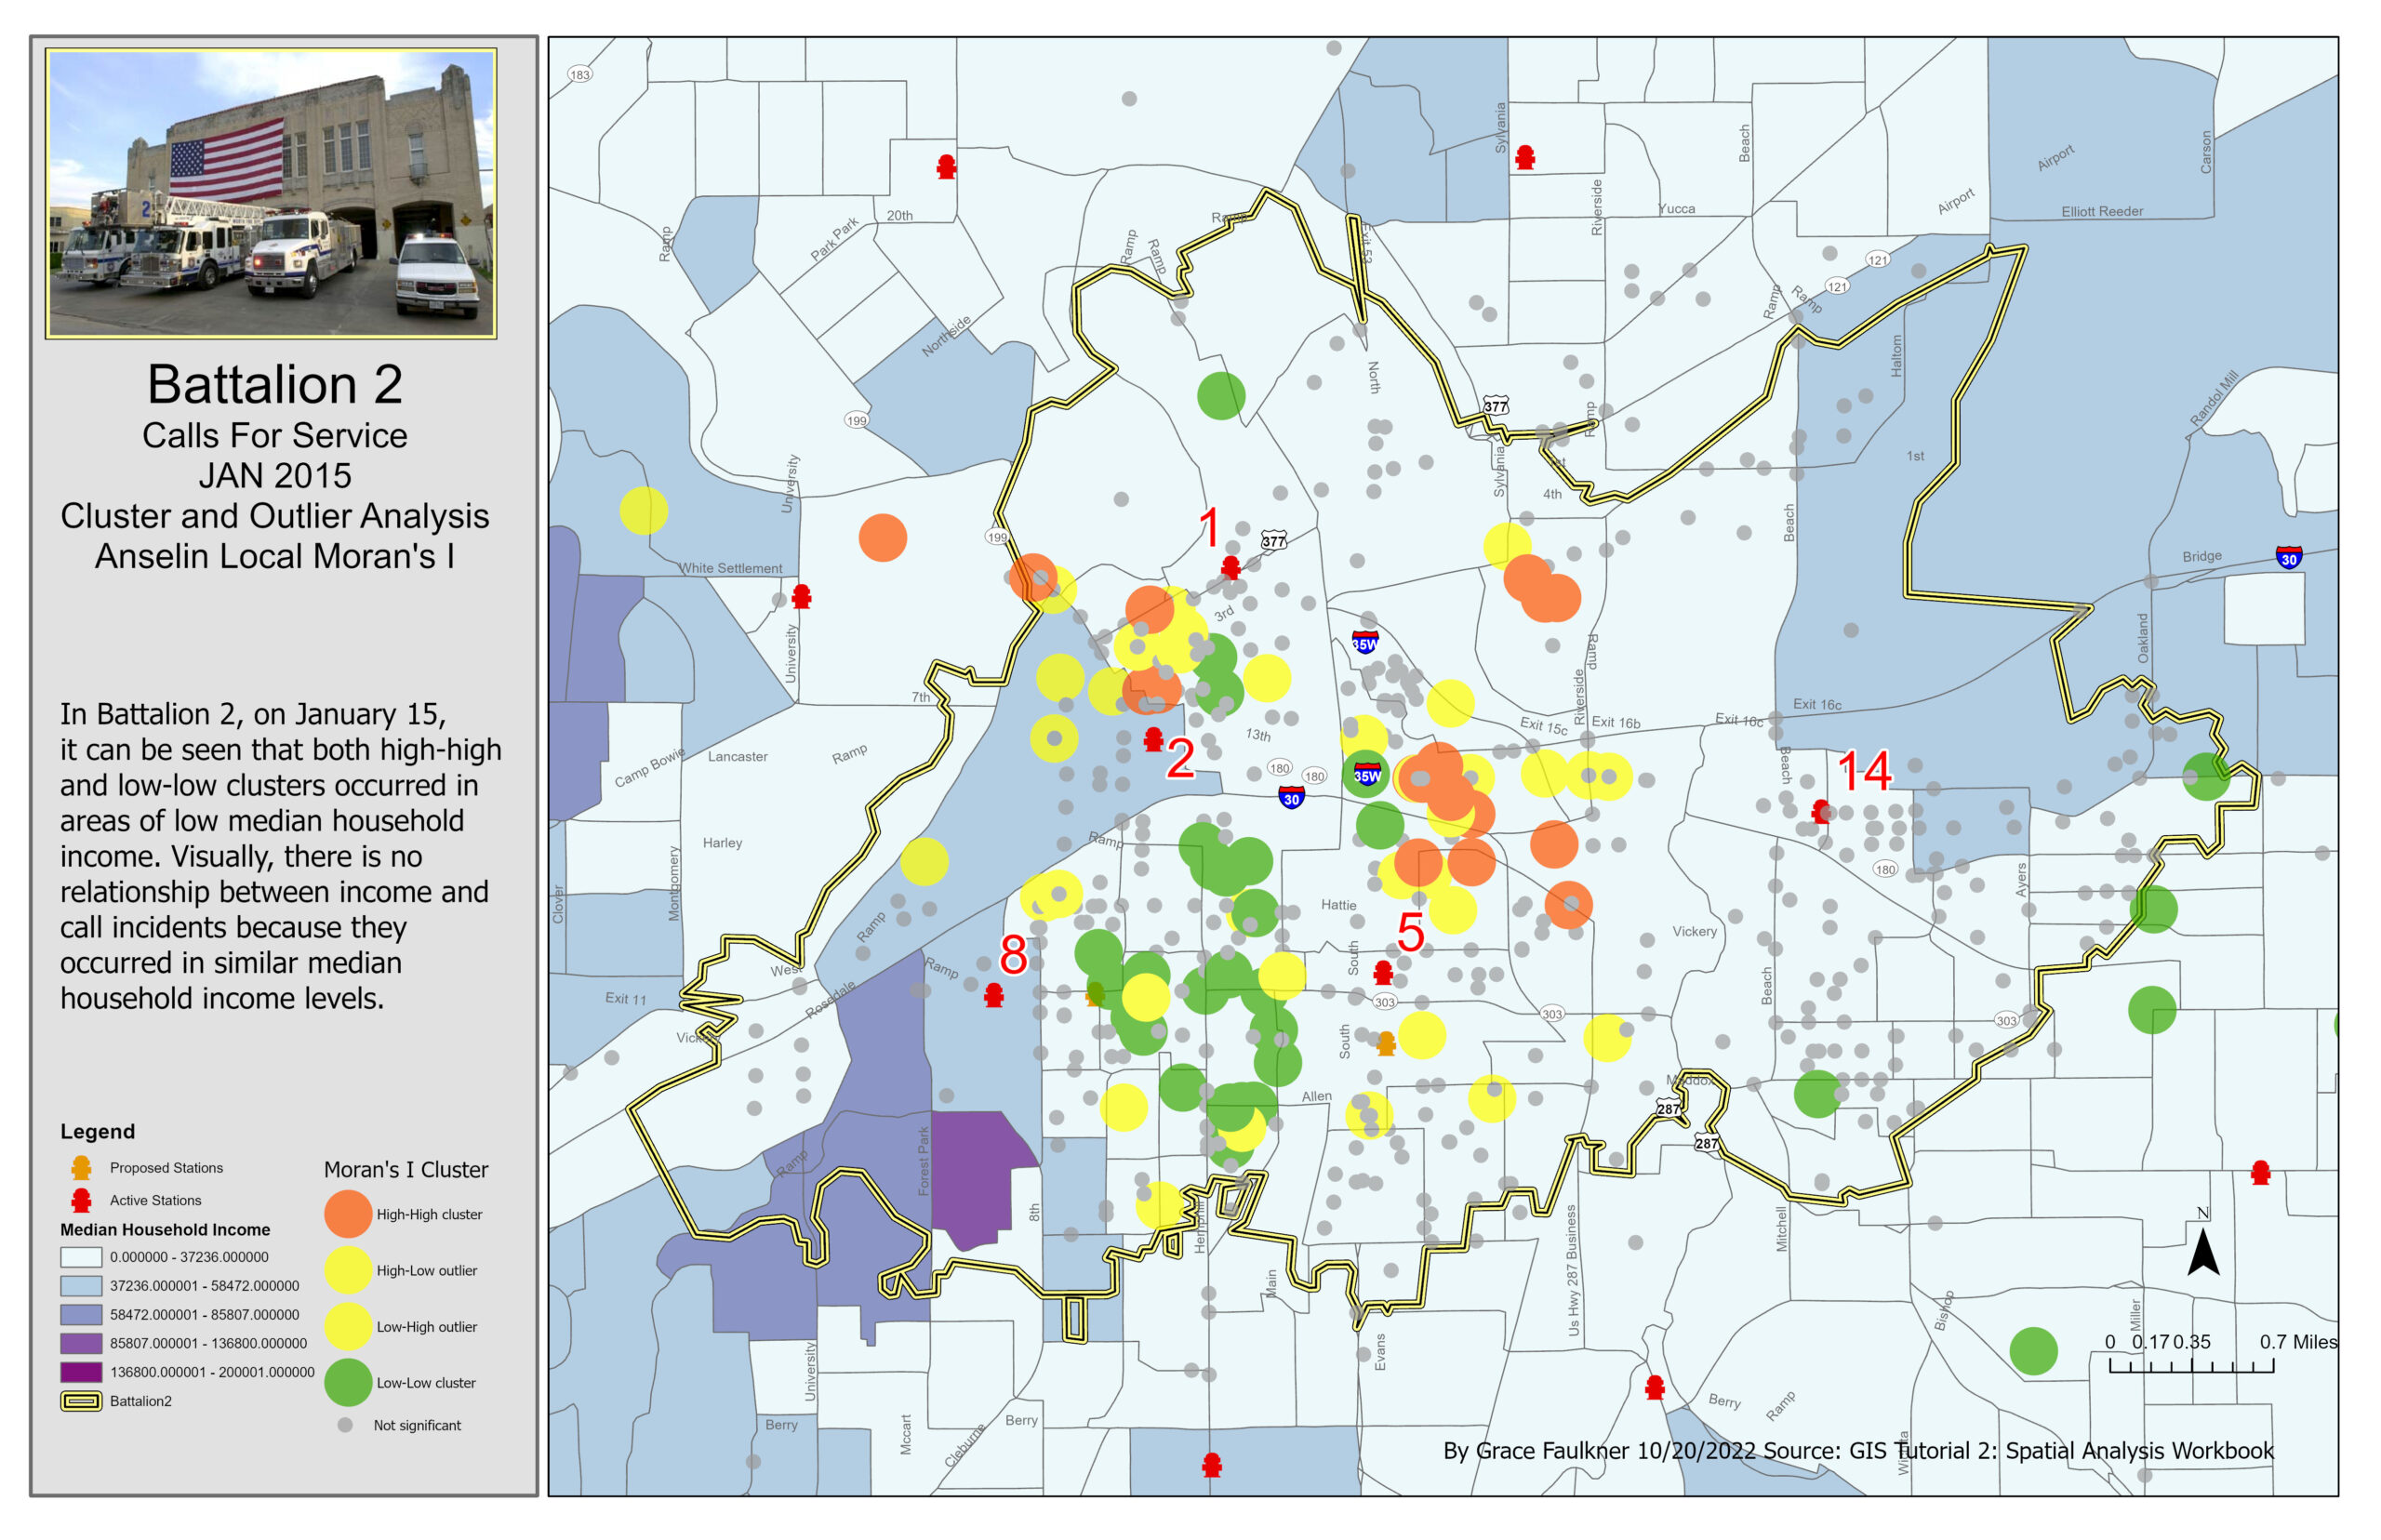
Cluster and Outlier Analysis of Alarms for Battalion 2 in January 2015
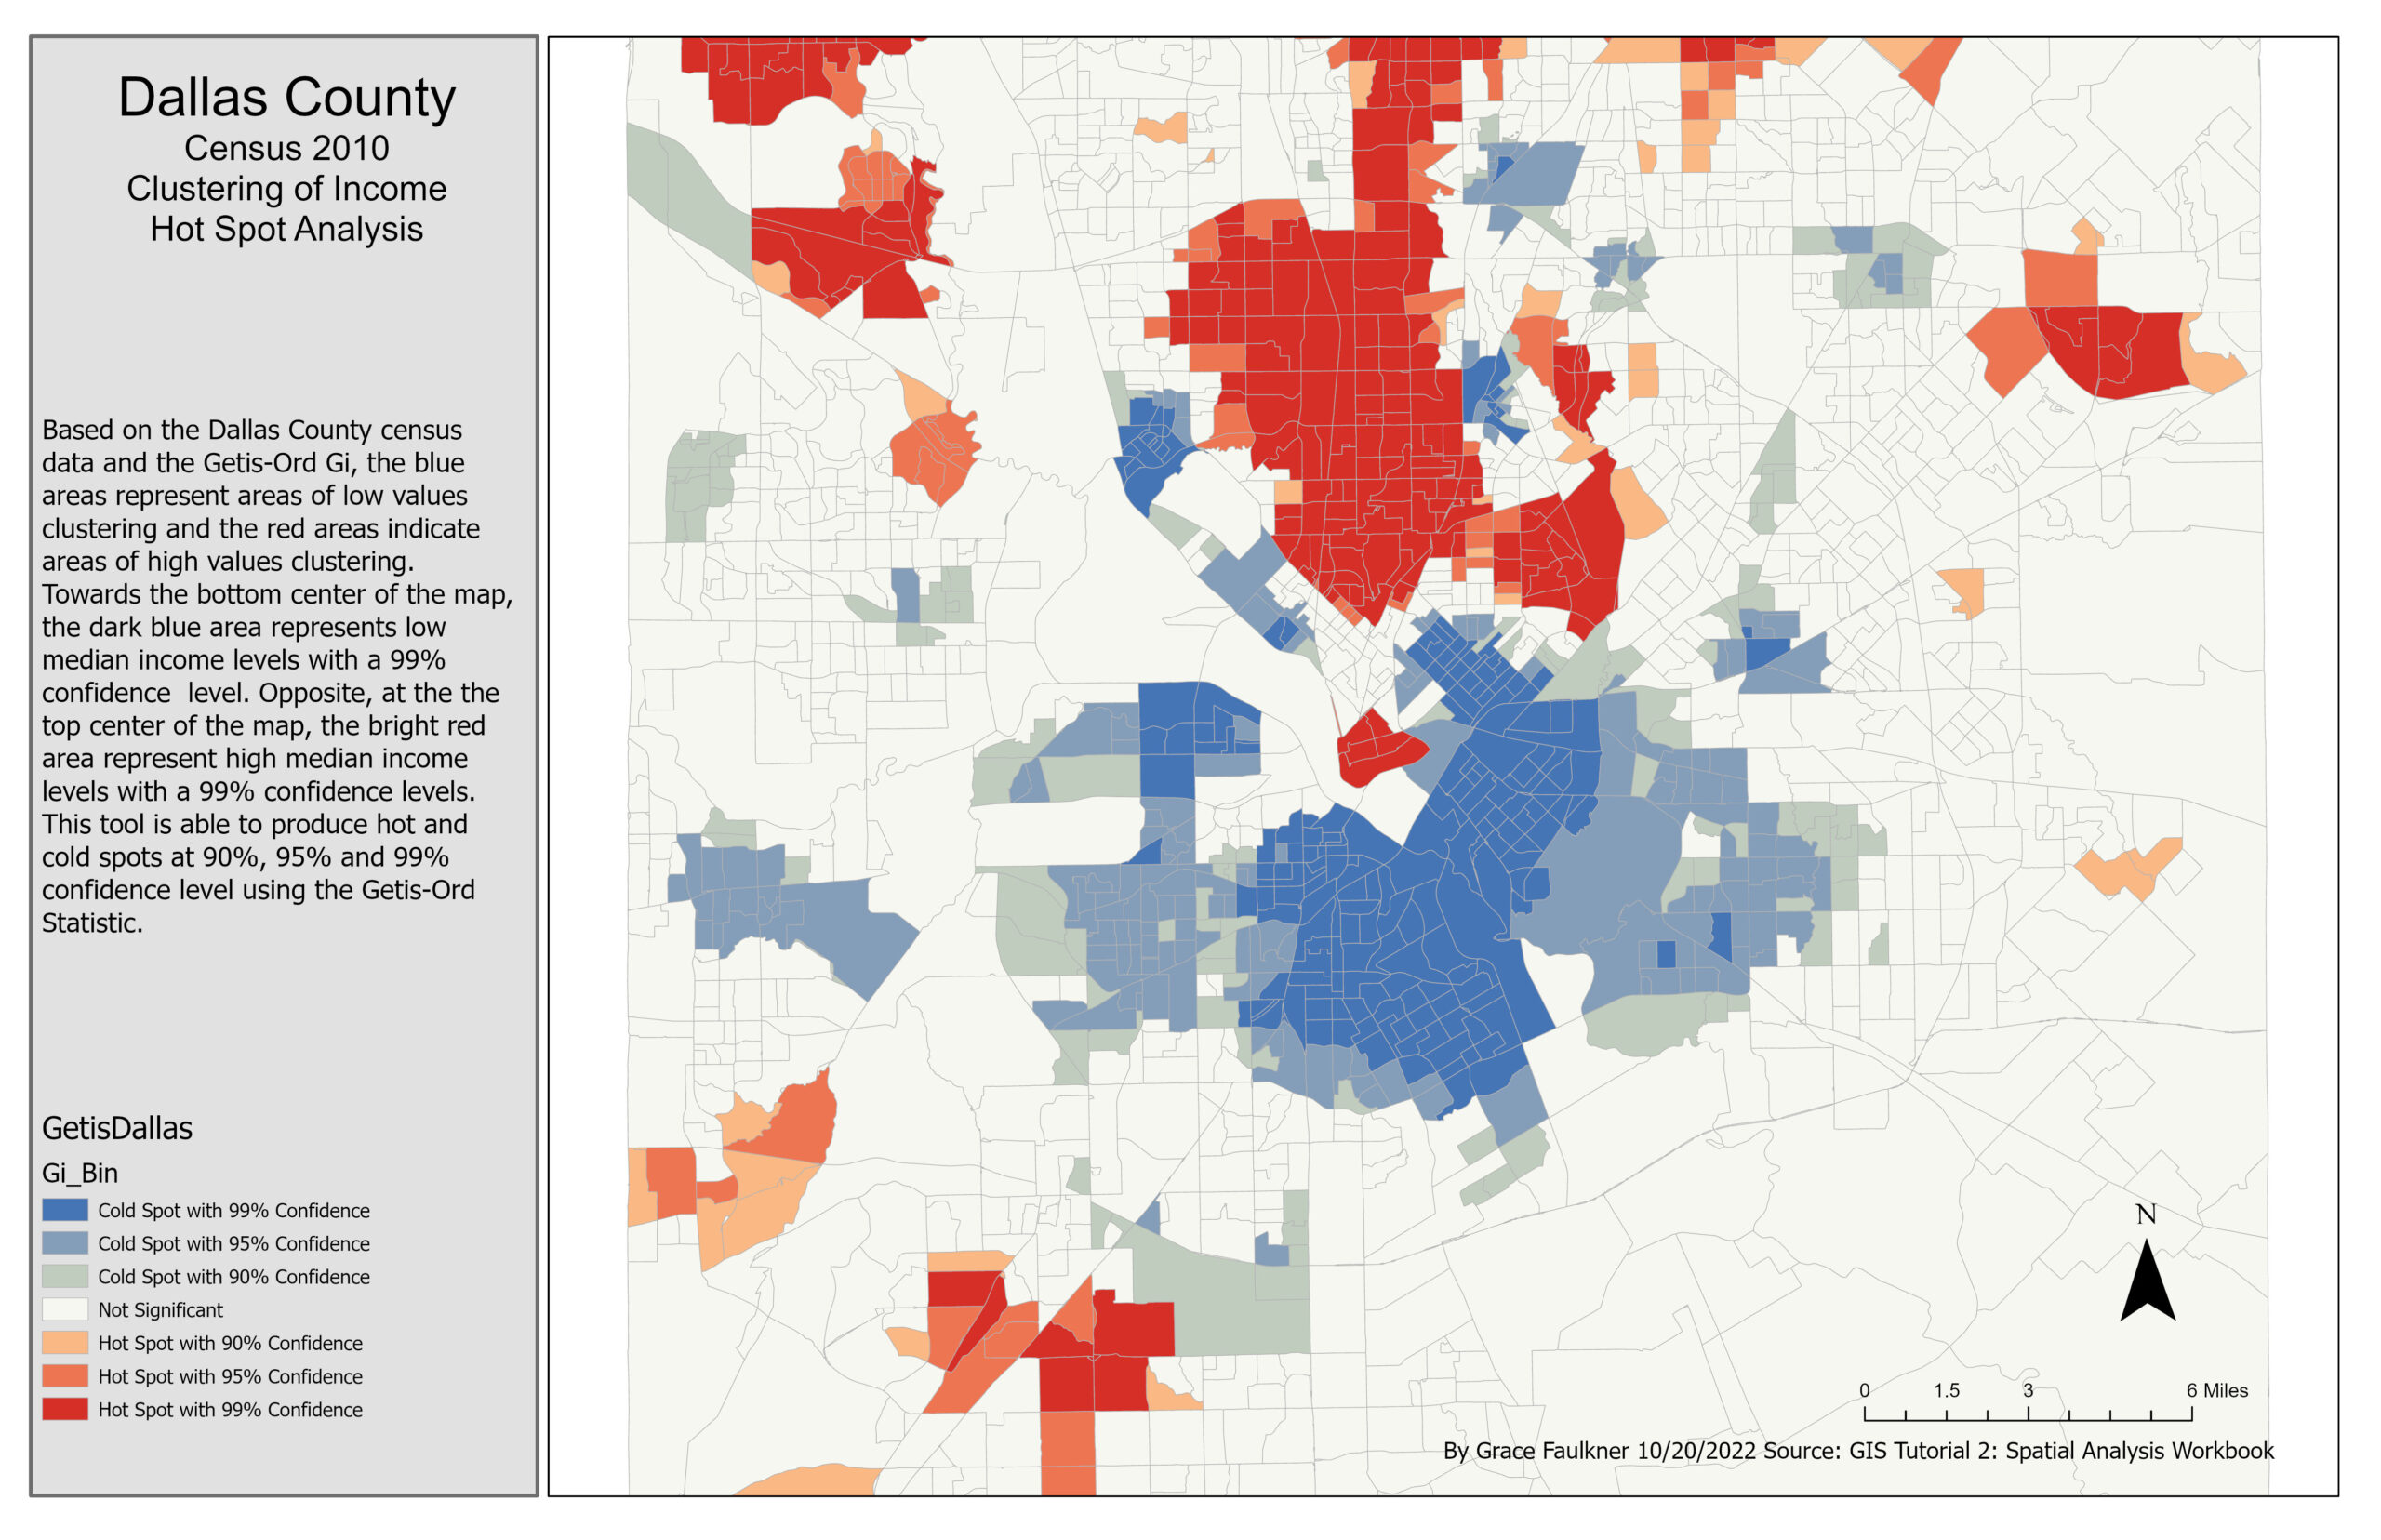
Hot Spot Analysis of Dallas County Household Income
Application and Reflection
The Spatial Statistics toolbox and the Mapping Clusters toolset gives GIS users the ability to identify patterns in a dataset by highlighting clusters of weighted attributes. These results can allow GIS users to analyze the data’s significance and help predict trends. In this assignment, the Cluster and Outlier Analysis tool ran a pattern-analysis calculation to symbolize the level of clustering by using high and low values and showed dispersion. It also produced a z-score to determine if the clustering is statistically significant. In the exercise, the fire department could confidently say where the clustering of high priority calls was occurring if that clustering was significant. This assignment also used the Gi* Hot Spot Analysis tool, which produced cluster areas of high values and low values after running a pattern-analysis calculation. The high values clusters were symbolized in red and the low values clusters were shown in blue. In the exercise, the economic office could confidently say where low and high median income households were located and where to direct the job creation efforts. In the exercise, this tool was used in emergency services and government intervention campaigns, but they could also be applied in other settings.
- Problem Description: In ecology and conservation, biologists could be interested in species clustering and habitat type in managed or protected areas. While geotracking species throughout the park over time, biologists could assess how long animals spend in different areas in the park. Conversationalists and park managers could use this information to target cold spots in the park to improve species dispersion and resource management.
- Data Needed: In order to assess animal dispersion in managed or protected areas, a GIS analyst would need geotracking data that recorded the animals movements and recorded time points. The animal movements could be geocoded to show where in the park the animal travels. In this attribute table, there were also need to be an aggregation of all the time points spent in the different areas in the park. Additionally, there would need to be a dataset of the different land cover classes or divisions across the park and/or a boundary shapefile of the managed area.
- Analysis Procedures: Using the GPS coordinates of the animal movements, the points could be geocoded and projected on a map. With each point, there would be an associated field of time duration. This attribute of time spent could be spatially analyzed to determine if there is any clustering of each land of habitation using a global calculation such as the High/Low Clustering tool. If it is determined there is significant cluster, a local calculation could be used to determine if/where the hot and cold spots are located across the park. The Gi* Hot Spot Analysis tool could be used to assess the weight of the time duration of each point. Then, overlaying these high and low clusters over habitat type could determine what locations in the park are highly used and correspond to necessary resources.