Working with US Census Data: Analyzing Clustering Patterns
Problem and Objective
The U.S. Census Bureau collects detailed information on the U.S. population and it’s general social statistics at various geographic levels. This data is a publicly available resource available in tabular data and covers a wide range of topics such as age, sex, race and ethnicity, housing units, employment, etc. This data can be combined with the Topologically Integrated Geographic Encoding and Referencing (TIGER) system for mapping and further analysis. Thus, this data has GIS application to provide useful information for informed decision making. The objective of this exercise was to download and join tabular U.S. Census Bureau data to related U.S. Census Bureau geography Tiger/Line files and to perform spatial pattern analysis. For example, the Office of State Human Resources in Hudson County, New Jersey (NJ) is interested in addressing the current rise in rent prices. In order to compare current prices, they want to know what rent was before the rise in prices. They are also interested to know if there is any clustering of rent prices in the census tracts compared to neighboring census tracts. Using the American Community Survey Median Gross Rent by Bedroom from the U.S. Census Bureau, thematic maps were created to display the cost of 1-bedroom apartments in 2018. In this exercise, I learned to search for, download, and integrate datasets from the U.S. Census Bureau, to locate, prepare, link and map U.S. Census tabular data with TIGER shapefiles, to prepare, analyze and integrate data of various formats and to apply global and local pattern analysis to U.S. Census data.
Analysis Procedure
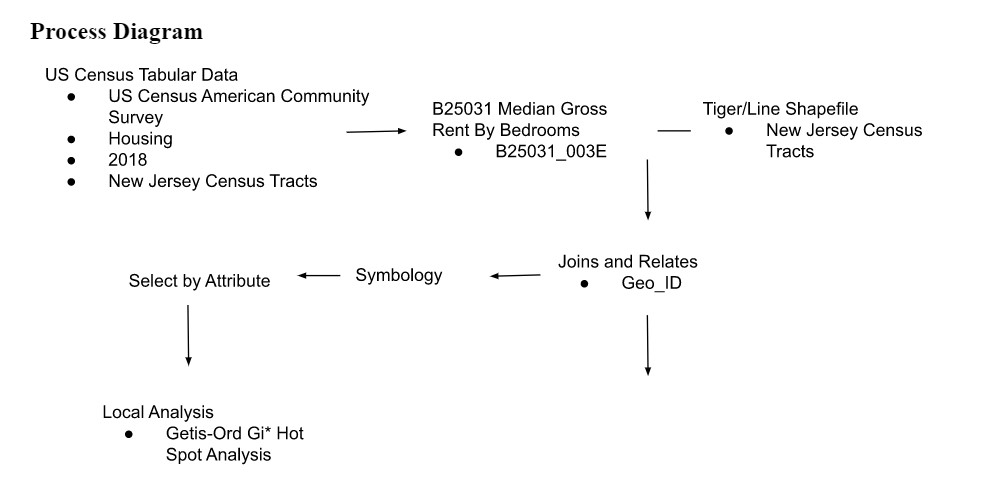
The U.S. Census Bureau has made census data available at the Explore Census Data website. This dissemination platform can be accessed to explore data related to population, housing, employment and health among other topics. Data from the Decennial Census that is collected every 10 years or more frequent surveys such as the American Community Survey are available. For this exercise, I used ArcGIS Pro 2.8, the Spatial Statistics toolbox, and the US Census Bureau website. In order to identify the spatial patterns and clustering of median rent prices, I used data from the American Community Survey and Tiger/Line shapefiles from the US Census Bureau. Specifically, I downloaded the 2018 Tiger/Line shapefile at the census-tract geography level for NJ (TL_2018_34_Tract.shp) and the 2018 American Census Survey 5-year estimate for Gross Total Rent at the census-tract geography level for NJ (ACSDT5Y2018.B25031) and used the variable for gross total estimate for a 1 bedroom apartment (B25031__00E). This data was used to produce a thematic map to display the range of the rent prices for a 1-bedroom apartment in Hudson County, NJ and to perform a local analysis of spatial clustering.
After downloading the shapefile and tabular data for census tracts and gross total rent for 1-bedroom apartments in NJ, I imported the data to Arcpro and created a join between the polygon layer and the tabular data using the Joins and Relates function. This join was based on the 11-digit Geo_ID between the two files. After the join was executed, I changed the symbology to graduated colors to create a choropleth map that showed the range of rent prices throughout the census tracts. In order to focus on Hudson County, I used the Search by Attribute tool to show only cases in Hudson County based on the starting digits that represent state and county in the Geo_ID (34017). Lastly, I performed a local analysis using the Getis-Ord Gi* Hot Spot Analysis tool based on the gross rent prices variable. I used this tool in order to focus on individual features and their relationship to nearby features because I was only focused on Hudson County, which had 166 census tracts). I wanted to use this tool because I wanted to determine how the gross total rent in one census tract compared to its neighbor. Using this tool, I was able to identify clusters of high gross total rent. These features were identified as hotspots in the analysis (high values that are clustered by neighboring high values). While using this tool, I employed a fixed distance band for the Conceptualization of Spatial Relationships.
Results
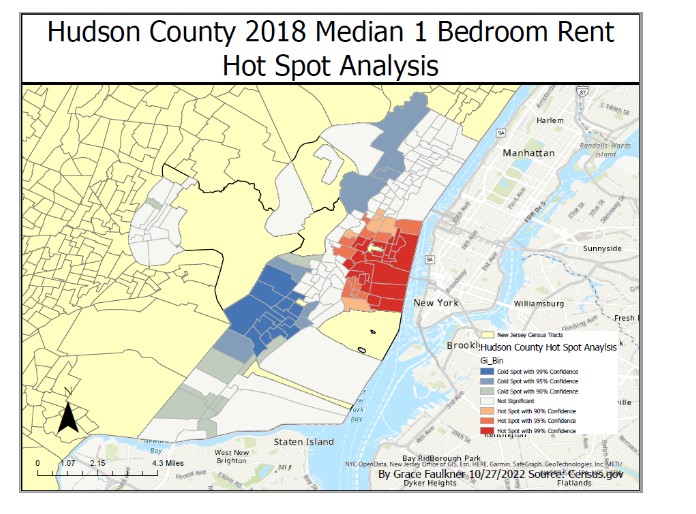
Hot Spot Analysis of 1-Bedroom Apartment Rent in Hudson County, NJ
Application and Reflection
The U.S. Census Bureau website provides publicly available, detailed information on snapshots of U.S. demography, which allows for thoughtful and informed decision making. Coupling this dataset with the Spatial Statistics toolbox on ArcPro allows further visual display and statistical analysis of the data. Using this dataset and the Mapping Clusters toolset allowed me to investigate and identify patterns in current housing topics, which could help predict future trends for this area. I used the local spatial statistics tool because I was focusing on a subset (county) of the state and wanted to identify clusters of features as they related to nearby features. In this exercise, I was able to search for and retrieve specific datasets from the U.S. Census Bureau and link to appropriate Tiger/Line shapefiles, which allowed me to prepare the data for local pattern analysis. I focused on housing data related to 1-bedroom apartment rent prices. However, there are many topics available through the Census Bureau website.
- Problem Description: During the COVID-19 pandemic, many schools adopted a remote or hybrid styling teaching plan. This requires student to have access to internet in order to attend classes and academic activities. However, some students may have differing connectivity. Policy makers and educators might be interested in internet usage and computer resources in 2020 in order to assess connectivity issues for remote learning.
- Data Needed: The U.S. Census website collects, records and publishes community survey information on internet connectivity and computer usage across the US at various geographic levels. In order to determine localized need, tabular data of the survey “Types of Computers and Internet Subscriptions” at the census block or census tract level could be downloaded for a state/region of interest. This data would be combined with the TIGER/Line shapefile of the area at the same geographic level.
- Analysis Procedures: Similar to this assignment, I would have created a join between the shapefile and the tabular data using the Geo_ID field and performed a local Hot Spot analysis to find any cold spots. I would have utilized the Add Join tool to perform an attribute join between the community census survey data and the TIGER/Line shapefile. Once the data was added, I would have performed a local calculation for spatial analysis to look for hot and cold spots of internet subscription and types of computers. The cold spots would indicate areas of low internet connectivity. This could help schools and local governments address needs for remote learning and prioritize resource distribution.