North Carolina Job Creation: Joins and Relates
Problem and Objective
A seemingly simple yet powerful tool for GIS users is the ability to create and integrate associations between tables from different data formations using the Joins and Relates function. Associations can be created between corresponding tabular data or spatially between a layer and a table or another layer. However, it is important to consider data cardinality- how the tables are related to one another. For instance, relationships can be one-to-many, many-to-many, one-to-many or many-to- many. The objective of this exercise was to to join tabular and spatial data at the ZIP code, Senate and House districts level to make visual comparisons between the created maps. For example, House and Senate members in North Carolina (NC) are interested in job growth across the state. They would like to see the number of jobs created in their own district and how it compares to neighboring districts. In this exercise, I learned to integrate and analyze data in various formats and apply appropriate analysis techniques for different types of decision-making objectives.
Analysis Procedure
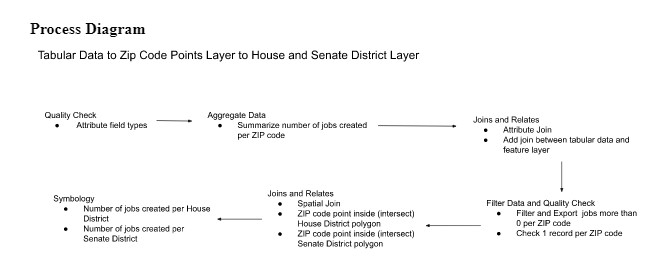
The Joins and Relates function allows common fields between datasets to be connected. In order to assess the data cardinality between the jobs created at the geographic scale house and senate districts, I used ArcGIS Pro 2.8 and the Joins and Relates functions. With the tabular data on job creation, I was able to aggregate the data and make attribute joins based on ZIP code information. I joined the number of jobs created per ZIP code to the ZIP code points layer. With the State House and Senate District data, I performed a spatial join of the number of jobs created per ZIP code that intersected the House or Senate districts. Finally, I changed the symbology to visually show the number of jobs created per House or Senate district. Data was obtained from website sources provided by the instructor.
For this exercise, after downloading the tabular and point layer data onto my map, I used Select by Attribute to filter my data to show only NC. In order to make attribute joins, I performed data quality checks to make sure the fields I wanted to join were the same field type. Next, I had to aggregate the tabular data on job creation using Summarize from a many-to-one to a one-to-one relationship in order to have the appropriate cardinaltiy for my join. After spotchecking to ensure there was only 1 record per ZIP code, I performed an attribute join using Add Join to join my number of jobs created per ZIP code to the ZIP code point layer. I then used Select by Attribute to filter the data to show jobs created that were greater than 0 and exported the data. In order to create the visual maps for the Senate and House members, I performed a spatial join to join the ZIP code point features that were inside the polygon feature of the House and Senate district polygon. I used the Spatial Join with the match option Intersect. Lastly, I checked the map projection to reflect NC and changed the symbology to visually show the number of jobs created in each House or Senate District.
Results
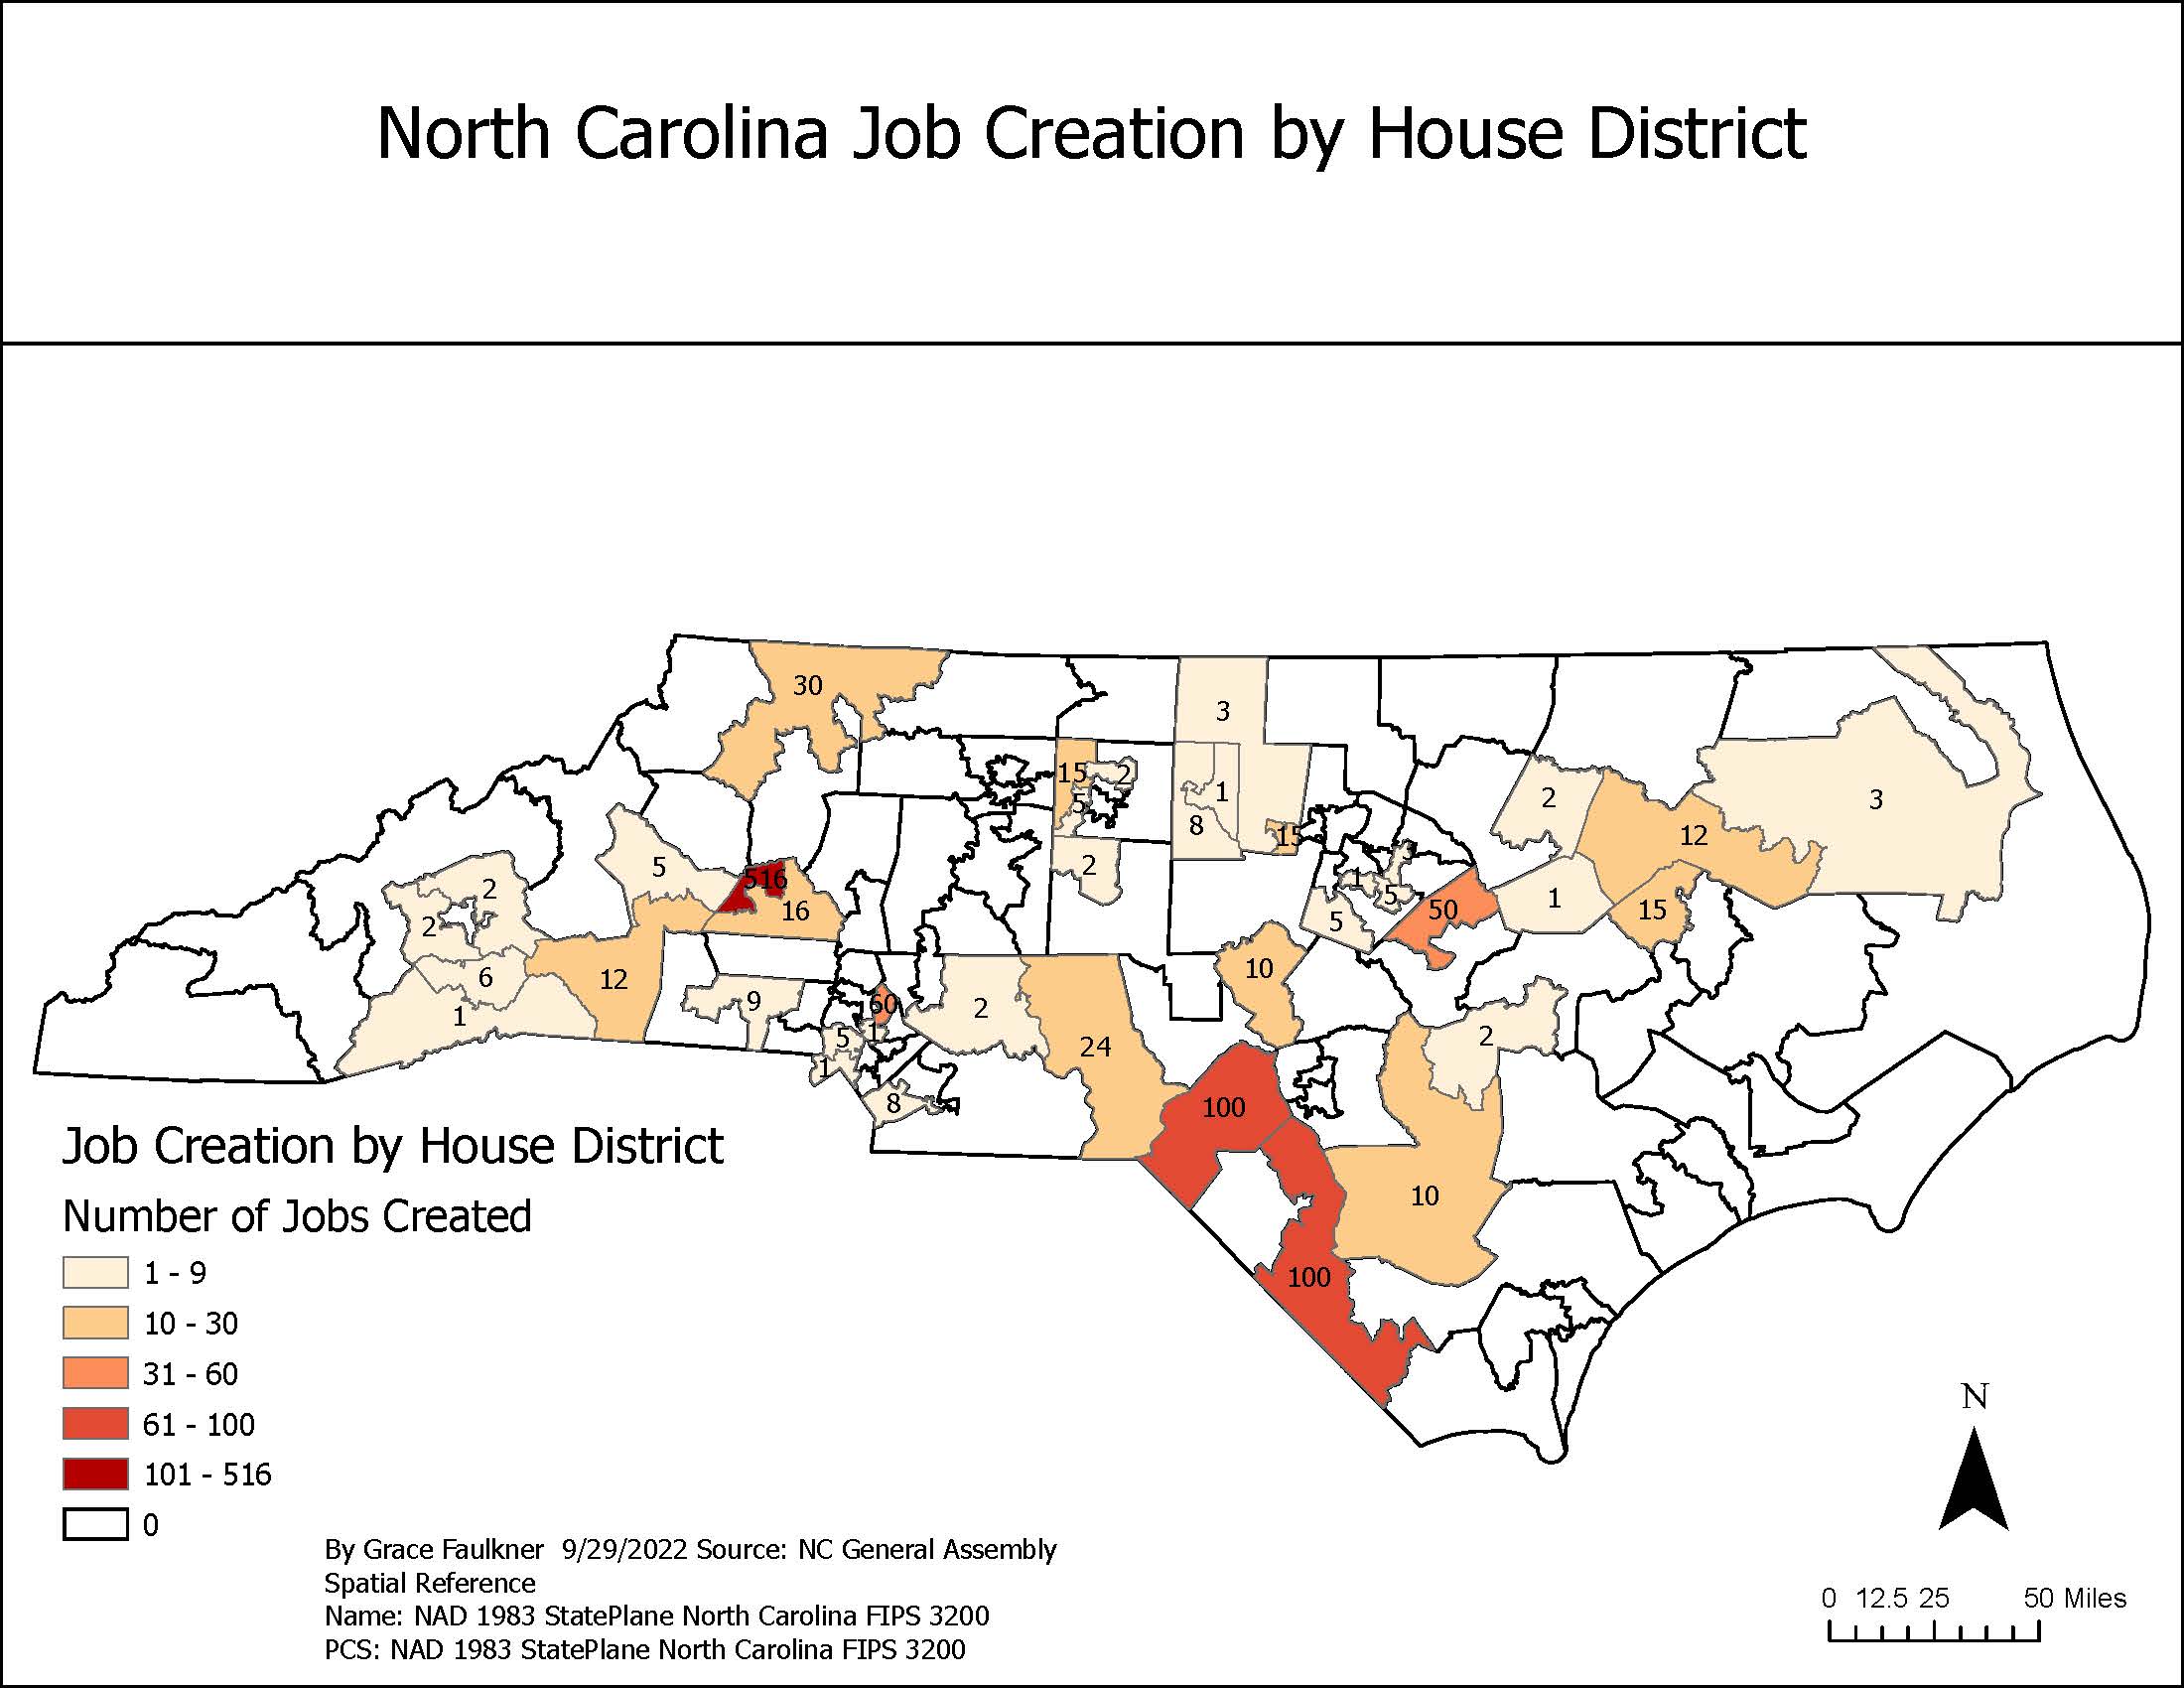
Number of Jobs Created by NC House District
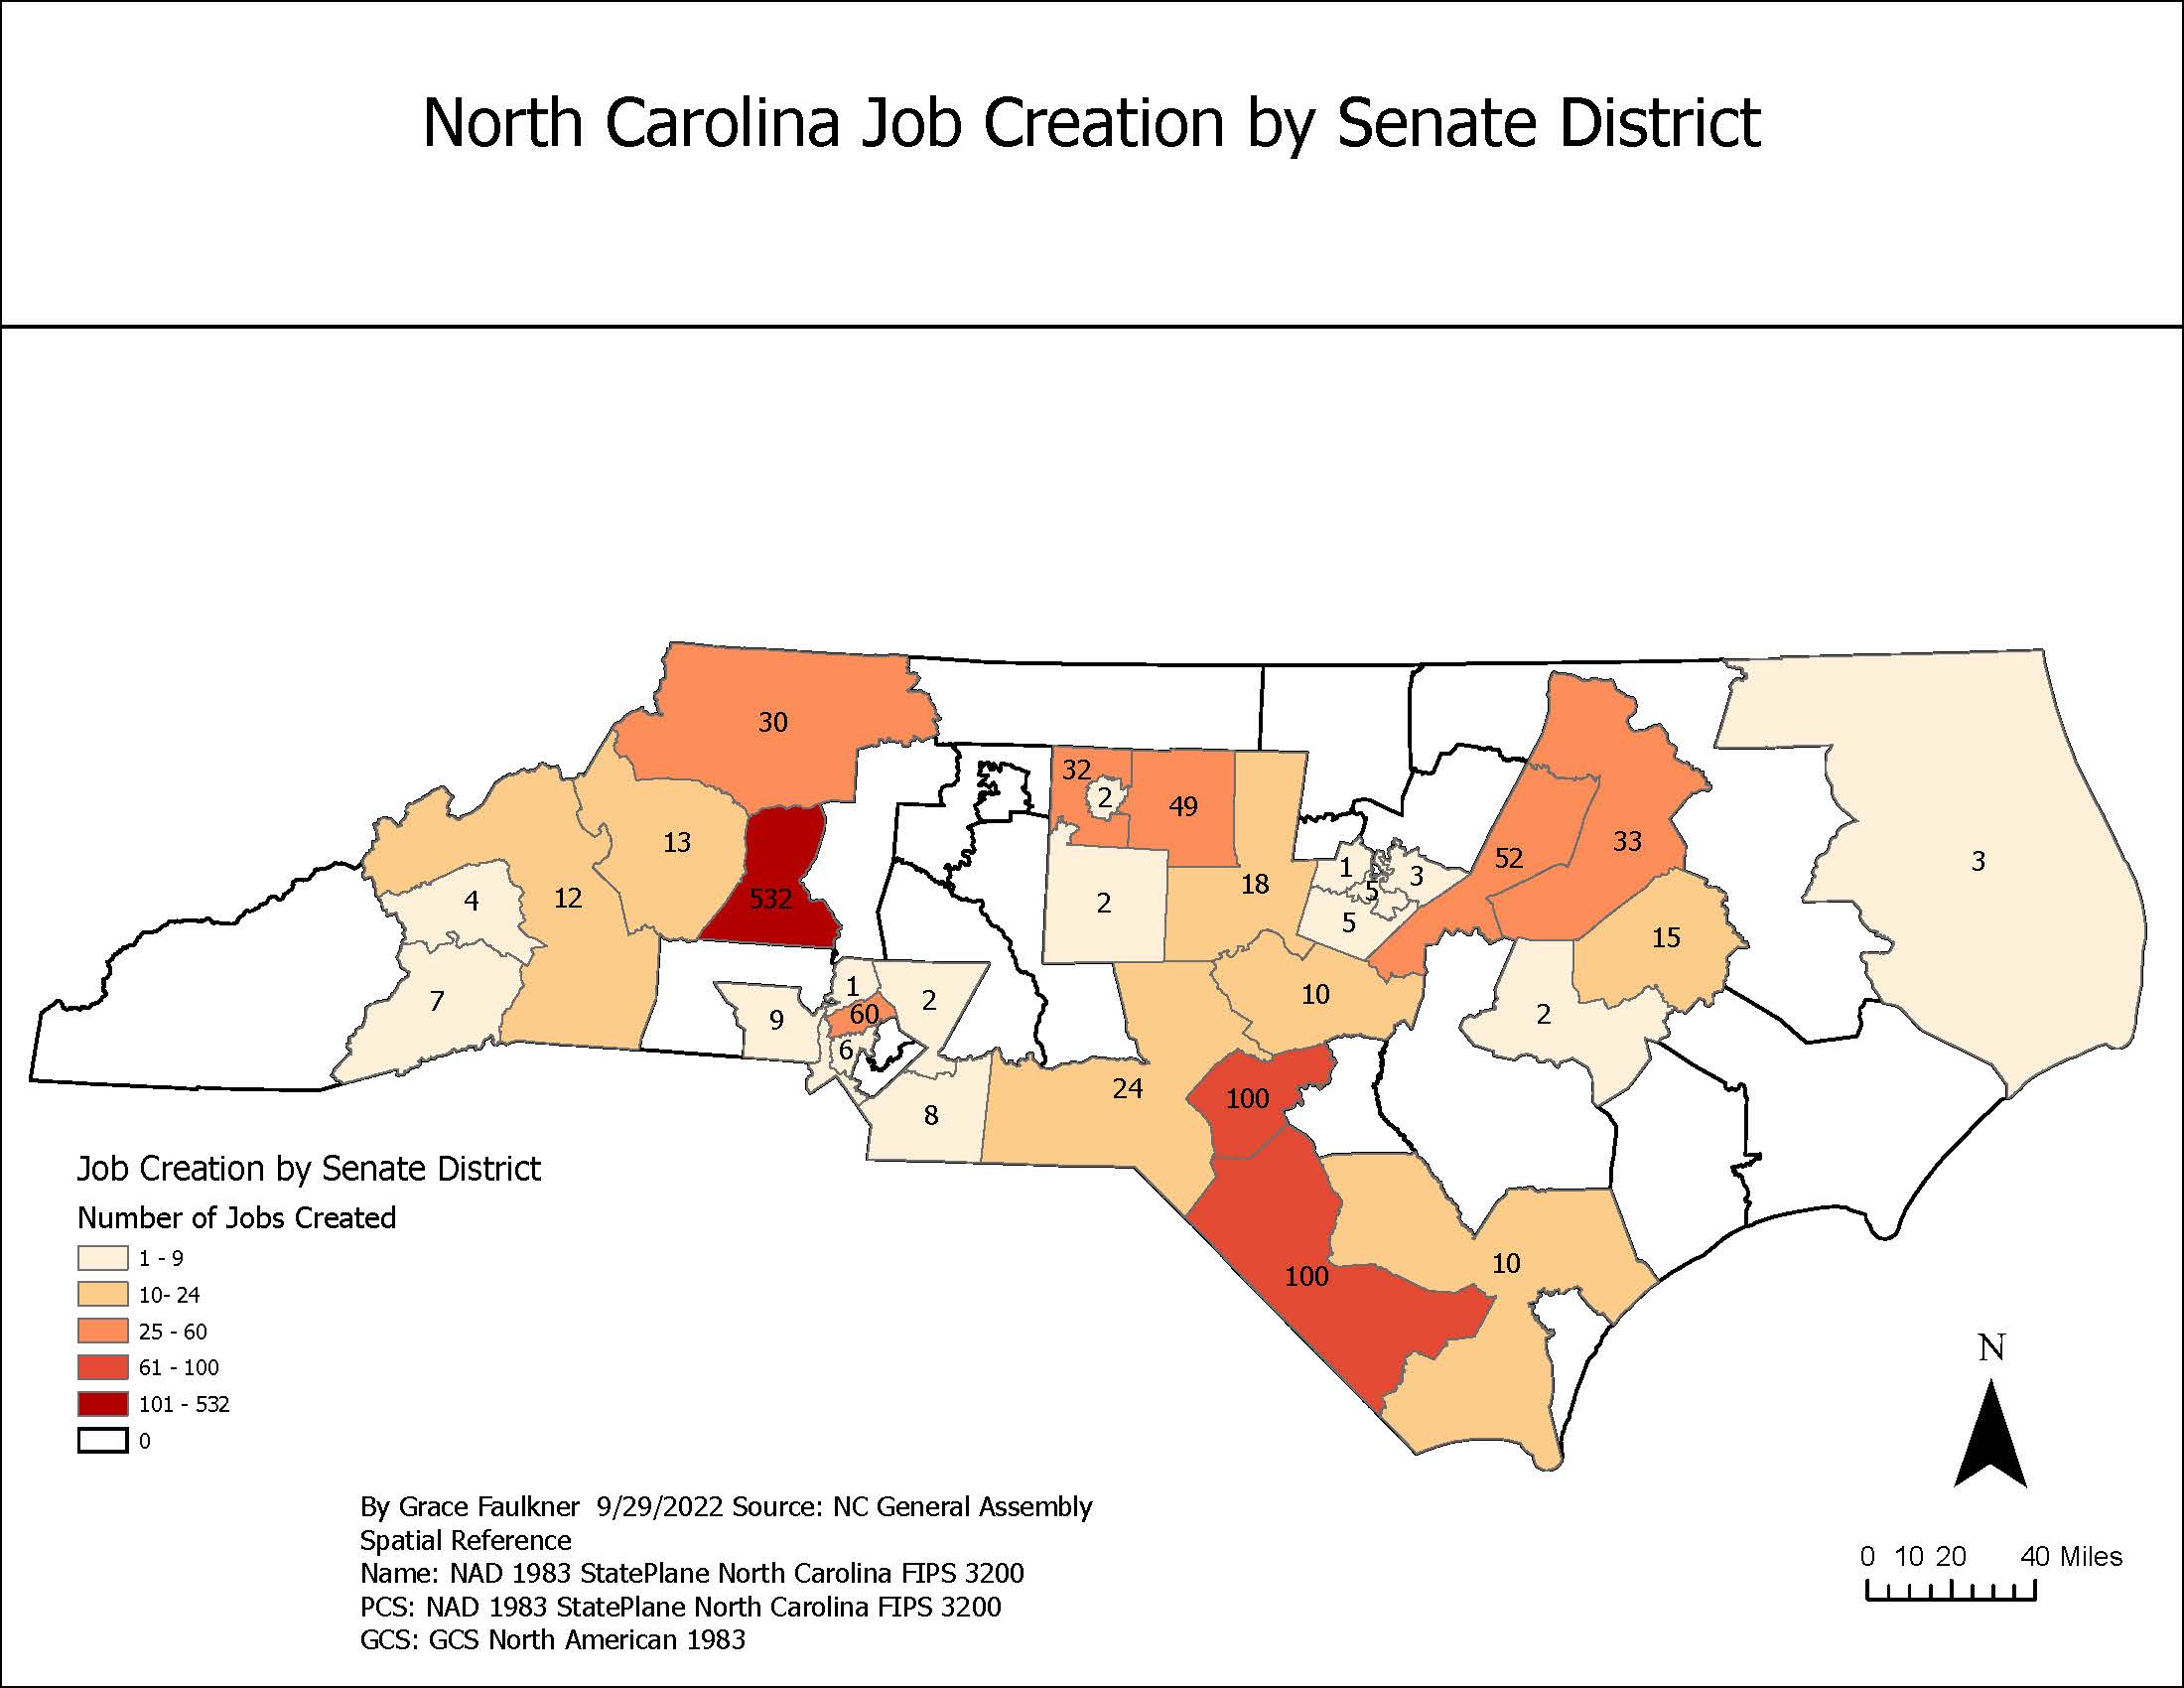
Number of Jobs Created by NC Senate District
Application and Reflection
GIS users will often have multiple different sources of information and it is important to be able to successfully establish associations between related datasets. However, in order to create these joins, I had to understand the cardinality between the datasets so as to not prevent record matching or omission errors. In this exercise, my visual representation was the output of attribute relationships that shared a common field and spatial relationships between layers based on location. I used a one-to-one attribute relationship and an intersection relationship. This methodology was applied to job creation based on house and senate districts but this function is widely applicable to other professions with different associations.
- Problem Description: Parents, educators, and public health officials might be interested in COVID vaccination rates among students across counties and the state. During the COVID-19 pandemic, vaccination status has been used as marker for community transmission and disease risk.
- Data Needed: In North Carolina, COVID-19 vaccination rates have been recorded through the NC COVID-19 dashboard. This tabular data could be downloaded to observe vaccination rates for those under age 18 at the county level. Using the NC One Map, a GIS user could download a shapefile of NC county boundaries and a shapefile of the NC boundary.
- Analysis Procedures: After uploading the tabular data and shapefiles to ArcPro, an attribute join based on a similar field could be used between the datasets. For example, vaccination rates by county could be joined to the county boundary shapefile based on the County field. Changing the symbology of the map to graduated colors to create a choropleth map would then show the vaccination rates by county across the state. In addition to understanding the vaccination rate in students under 18 by county in NC, parents and educators might be interested to know how many total vaccines have been administered across the state in comparison to other states. Using a spatial join, county boundaries within NC could be aggregated to determine the sum of vaccines administration to students under 18.