Identifying Suitable Bear Habitat in Smoky Mountain National Park: Suitability Analysis and Weighted Overlay
Problem and Objective
Suitability models are used to identify the most suitable location for a specific phenomenon. However, some factors may have differing importance. In order to apply a common scale of values to diverse and dissimilar inputs, a weighted overlay can be be applied a suitability model for an integrative analysis. The weighted overlay will analyze each factor and then combine the data layers into a single raster based on the weighted importance. In this exercise, the objective was to create a weighted suitability model based on least favorable, favorable and most favorable criteria of five different factors in order to prepare a map that would display the most suitable areas. For example, biologists at the Great Smoky Mountains National Park have noticed an increase in human-animal conflict between visitors and black bears around roads and trails in the park. The biologists want to know if there are areas in the park that would provide basic needs for the bears that would reduce visitor interaction. In this exercise, I learned to create a suitability analysis using a weighted overlay function and became familiar with ModelBuilder in ArcGIS.
Analysis Procedure
The objective of this assignment was to run a Weighted Suitability Model. Using the Weighted Overlay tool, each factor can be analyzed and integrated for suitability analysis. In order to identify the suitable land for bear habitat in the park, I used ArcGIS Pro 2.9 and the following tools: Slope, Feature to Raster, Distance Accumulation, Reclassify and Weighted Overlay. These tools created rasters that were used to generate a Weighted Suitability Model in order to identify suitable bear habitat. Data and the factors and criteria for the model were provided from the instructor.
First, I reviewed my data sources and selected the output coordinates and raster analysis cell size for the datasets. Next, I had to transform the vector data of the factors and then reclassify the criteria based on provided categories (Least favorable, Favorable, Most Favorable). Using the provided vector data from the instructor, I went through the layers for each factor to create raster datasets. I used the Distance Accumulation tool for the factors “Distance to Roads”, “Distance to Streams”, and “Distance to Trails”. I used the Slope tool to generate a raster for “Elevation”. I used the Feature to Raster tool to generate a raster for “Vegetation”. After generating the rasters, I had to reclassify them using the Reclassify tool so that the criteria would have a common scale in the suitability analysis. Each raster was reclassified according to the provided criteria (Least favorable, Favorable, Most Favorable). Then, I created the suitability model using the Weighted Overlay tool. Each factor was weighted the same (20%) and the model produced a raster feature layer of the suitable bear habitat.
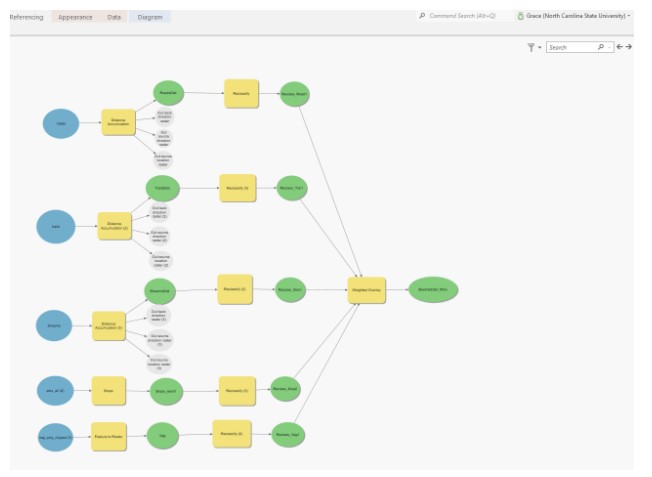
Finally, I created a Model diagram using the ‘Model Builder’ with the geoprocessing tools history. The ‘Model Builder’ visualized and organized the steps involved in creating the model.
Model Builder
Results
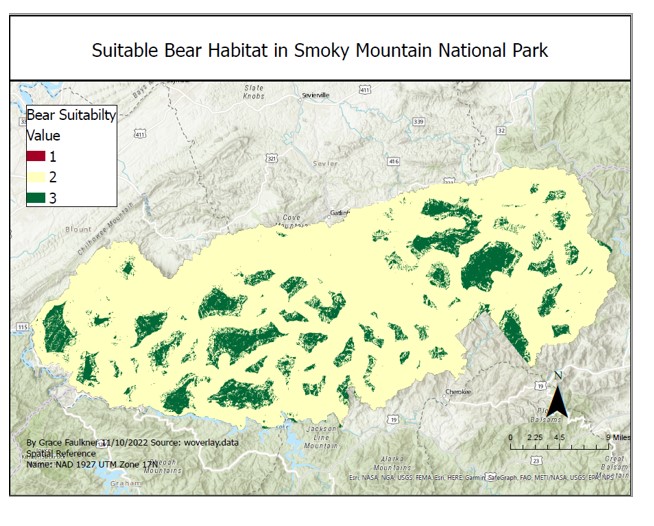
Suitable Bear Habitat in Smoky Mountain National Park addressing Human-Animal Conflict
Application and Reflection
Suitability modeling allows GIS users the ability to identify locations that are the most optimal site for a given phenomenon according to a range of criteria. The suitability model uses generated rasters that represent values on a scale of suitability. After reclassifying the rasters, all the criteria can be assessed on the same scale. Further, if some factors are weighed more heavily than others, the suitability model can reflect this. Although this process is similar to suitability modeling, the weighted overlay tools combines the analysis process within a single tool. For instance, the reclassifying, weighting and merging of the rasters all occurred within the Weighted Overlay tool. In this exercise, biologists at Smoky Mountain National Park were interested in finding suitable bear habitat in order to reduce human-animal interaction. Based on the provided factors and criteria, a model and map were created that showed areas in the park that were most suitable for bear habitat and limited human-bear interaction. Suitability modeling can be applied beyond park and natural resource management.
- Problem Description: In housing and development, a suitability model could be created and utilized to determine the best location for a new apartment building. City planners and construction companies may be interested in identifying the most optimal site for a new build that will be attractive to renters and cost efficient to build.
- Data Needed: To create this suitability model, the model will need a defined goal, criteria, and factors. For example, the goal is to build a new apartment complex that is attractive to renters and cost efficient. The criteria and factors will reflect the goal by defining the model variables and the values that are considered suitable for each variable. For optimal site selection, the model could consider factors such as proximity to roads, utilities, and existing infrastructure, environmental characteristics such as slope of land, land class and lot vacancy, and population characteristics such as population density and age. This type of data on roads and preexisting infrastructure could be acquired through local government websites. The environmental data such as slope and elevation is available through the U.S. geological survey. Population characteristics can be accessed through the U.S. Census Bureau website.
- Analysis Procedures: Once the data has been obtained, the Weighted Overlay process can be used to transform the vector data to raster data and create a suitability model. Using similar tools such as Slope, Feature to Raster, and Distance Accumulation, raster datasets for each layer could be created. For instance, the data regarding infrastructure to assess proximity to roads would be transformed by the Distance Accumulation tool and environmental conditions such as slope would be transformed using the Slope tool. After the layers are generated to rasters, I would use the Reclassify tool to create a common scale across the factors for the suitability analysis. Lastly, to generate the output raster of suitable locations for the build, I would use the Weighted Overlay tool. This analysis process would help construction agencies and GIS analysis could work together to identify the most suitable land for an upcoming build.