Suitability Modeling and Creating a Weighted Suitability Model
Problem and ObjectiveSuitability modeling is a type of analysis that locates places that are suitable or favorable for a certain phenomenon. The model is driven by an effective goal and suitability criteria. The goal of the model defines the phenomena, study area and purpose of the analysis. The model criteria defines the model variables and the values that are considered suitable for each variable. A suitability model is used to create a raster that represents suitability as values on a scale and the highest values on the scale represent the most suitable locations. The objective of this exercise was to complete two ESRI web courses: “Suitability Modeling: Introduction” and “Suitability Modeling: Creating a Weighted Suitability Model”. For example, a weighted suitable model was created in order to identify three optimal regions of bald eagle habitats in the San Bernardino National Forest. In this exercise, I learned to understand what real-world problems a suitability model can address, to define analysis goals and suitability criteria, to prepare data for a suitability model, to create a suitability model and to evaluate the results.Analysis ProceduresThe suitability modeling process involves creating rasters to represent each model criterion, and then combining the rasters into a single surface that meets the model goal. The following steps are involved in suitability modeling:
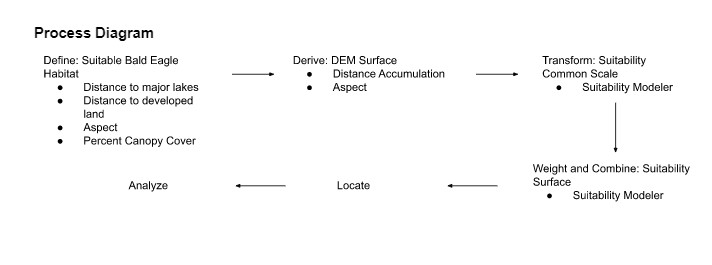
Define > Derive > Transform > Weight and combine > Locate > Analyze. For this exercise, I used the Spatial Analyst toolbox and the Distance toolset.
First, I defined the problem by identifying a goal and supporting criteria that can be modeled with data. This exercise was interested in identifying suitable bald eagle habitat in the San Bernardino National Forest. Bald eagle habitat is influenced by environmental factors like by distance from major lakes, distance from developed areas, aspect, and percent canopy cover. Next, I derived the necessary datasets from readily available source datasets to obtain data that represents the model variables. The derived data is used as input for the suitability model. Using the provided data of the factors from the National Land Cover Database and the Advanced Spaceborne Thermal Emission and Reflection Radiometer, I set the environment for the raster analysis and derived each raster. To derive the surface for distance to major lakes, I used the Distance Accumulation tool. To derive the surface for distance from developed areas from NLCD Land Cover, I removed the land cover classes that did not include developed areas and then used the Distance Accumulation tool. To derive the aspect surface, I used the Aspect tool. Then, I transformed the derived data in the suitability model to a common suitability scale. Using the Suitability Modeler, I transformed the lake distance raster, the developed distance raster, the canopy cover raster and the aspect raster. After that, I weighted and combined the transformed data in the suitability model to create a single suitability surface. Using the Suitability Modeler again, I assigned weights to each suitability raster based on the provided criteria. The modeler combined the rasters to calculate a suitability surface of suitable bald eagle habitats. Thus, the generated output locates sites that are suitable for the modeled phenomenon by using the suitability surface and I was able to analyze the result by visually evaluating the suitability surface and regions to ensure that the model goal has been met. For example, I was able to define the shape and characteristics of the candidate regions and answer the question: Does the suitable region meet the model goal?
Results
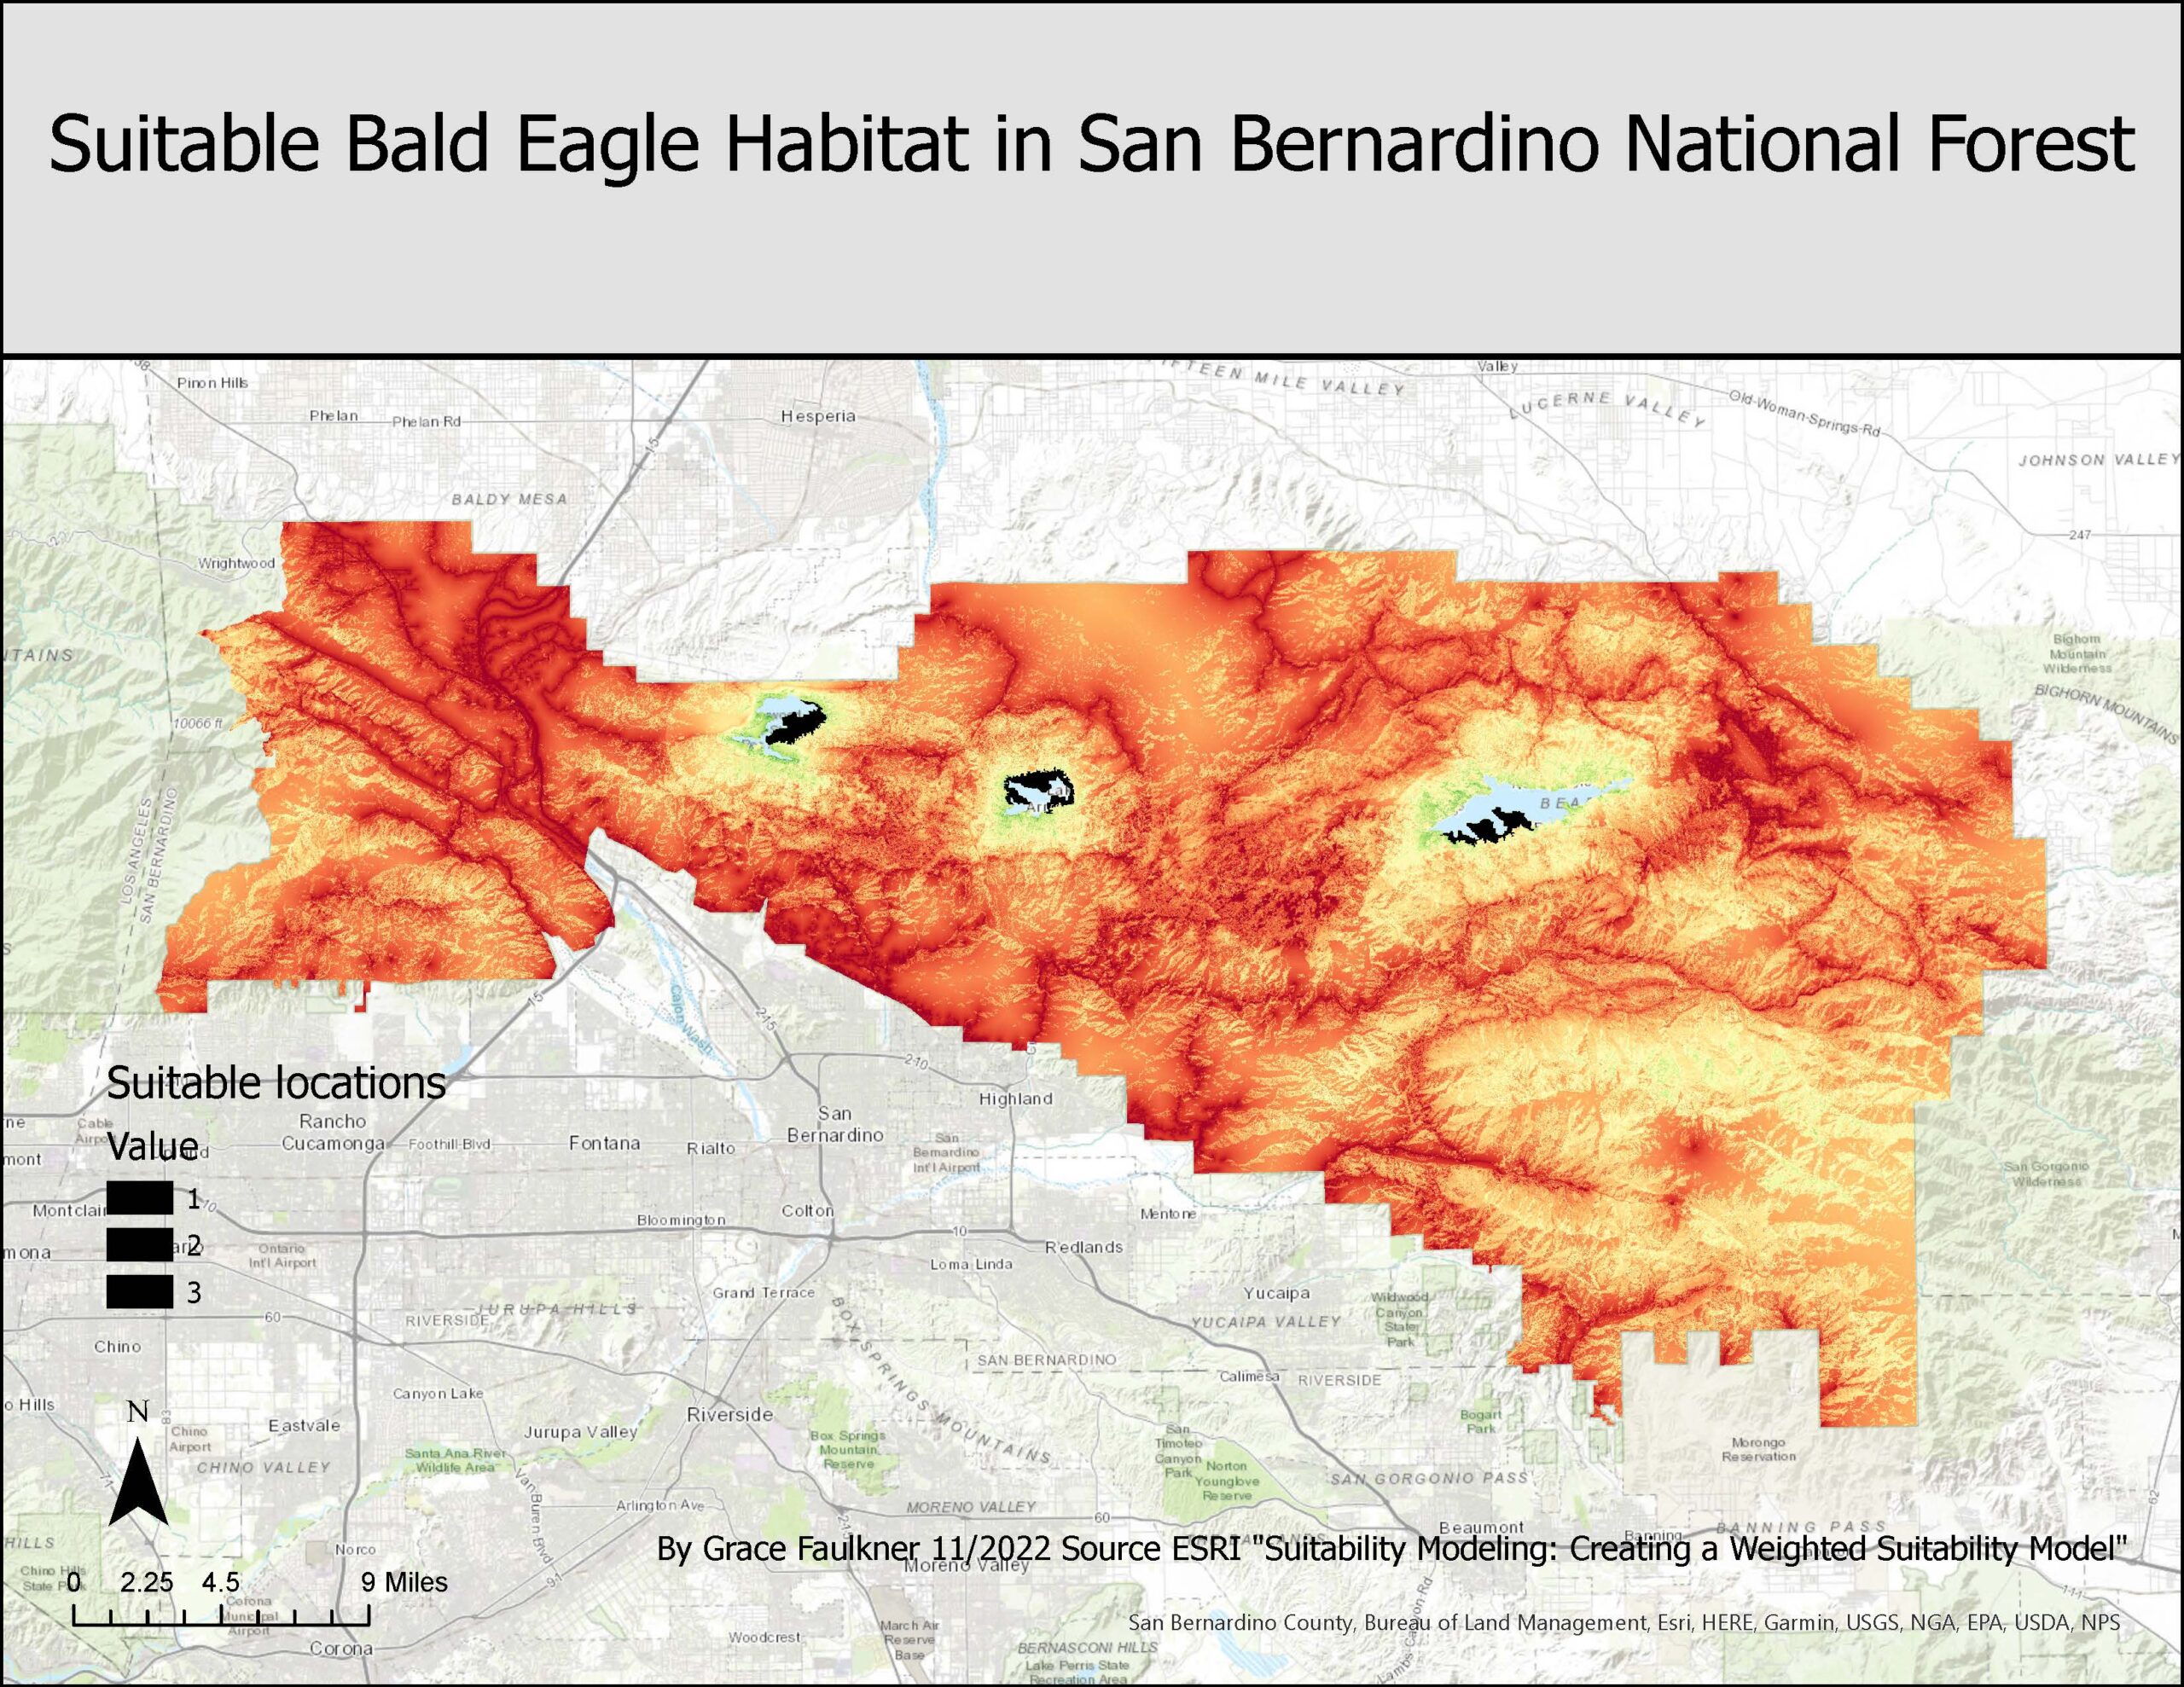
3 Suitable Bald Eagle Habitat Areas in San Bernardino National Forest
Application and Reflection
For GIS users, suitability modeling is an analysis-process to identify locations that are most suitable for a certain phenomenon. This analysis defines the goal, criteria ,and factors necessary and a method for evaluating the model. By using a suitability model, multiple features at each location can be assessed and weighted in order to create a map that will identify preferential areas/locations. A weighted model has the additional benefit of incorporating criterion to each factor to better reflect and model real world conditions. In this exercise, a weighted suitability model was created to identify optimal bald eagle habitat in the San Bernardino National Forest. However, this modeling process can be used beyond resource management.
- Problem Description: Agriculturalists might be interested in determining optimal site selection for their crop locations. Before planting, they could assess their land in order to determine which areas might be best for growing and cultivation.
- Data Needed: Before making crop fields and planting, the agriculturalists need to define their goal and the criteria and factors related to the goal. The goal of the model is to identify the most optimal fields for crop planting. The agriculturalists will need information on the crop and environmental conditions needed for optimal production. For example, this model will need layers related to the slope and aspect of the land, the land and soil types, and the distance to water sources.
- Analysis: Once the data is obtained, I would need to first derive the data to raster datasets. I could convert the data using tools such as Distance Accumulation, Slope, and Aspect tool based on the criteria of the factors. Next, I would transform the individual surface layers to a composite suitability surface using the Suitability Modeler. This tool would generate an output that identifies the areas that are most optimal for crop production.